How to Create Your Own Technical Indicators in TradingView
TradingView is a powerful platform for traders and investors, offering advanced charting tools, real-time market data, and customizable technical indicators for analyzing stocks, forex, crypto, futures, and more. If you want to enhance your trading strategy, TradingView has you covered. In this blog post, we'll walk you through creating your own technical indicators to improve your technical analysis and strategy development.

Jordan Wu
12 min·Posted

Table of Contents
TradingView
TradingView is a charting and analysis platform designed for traders and investors across various investment vehicles, including stocks, forex, crypto, and commodities. It offers advanced customizable charts, real-time market data, and a vast library of technical indicators. Making my go-to tool for conducting in-depth technical analysis and developing strategies. Its intuitive interface makes it user friendly and its social networking features allows users to share trading ideas and analyze trends. By leveraging its tools for technical analysis, backtesting strategies, and learning from experienced traders, you can make more informed decisions, refine your trading skills, and ultimately become a better investor.
Screeners
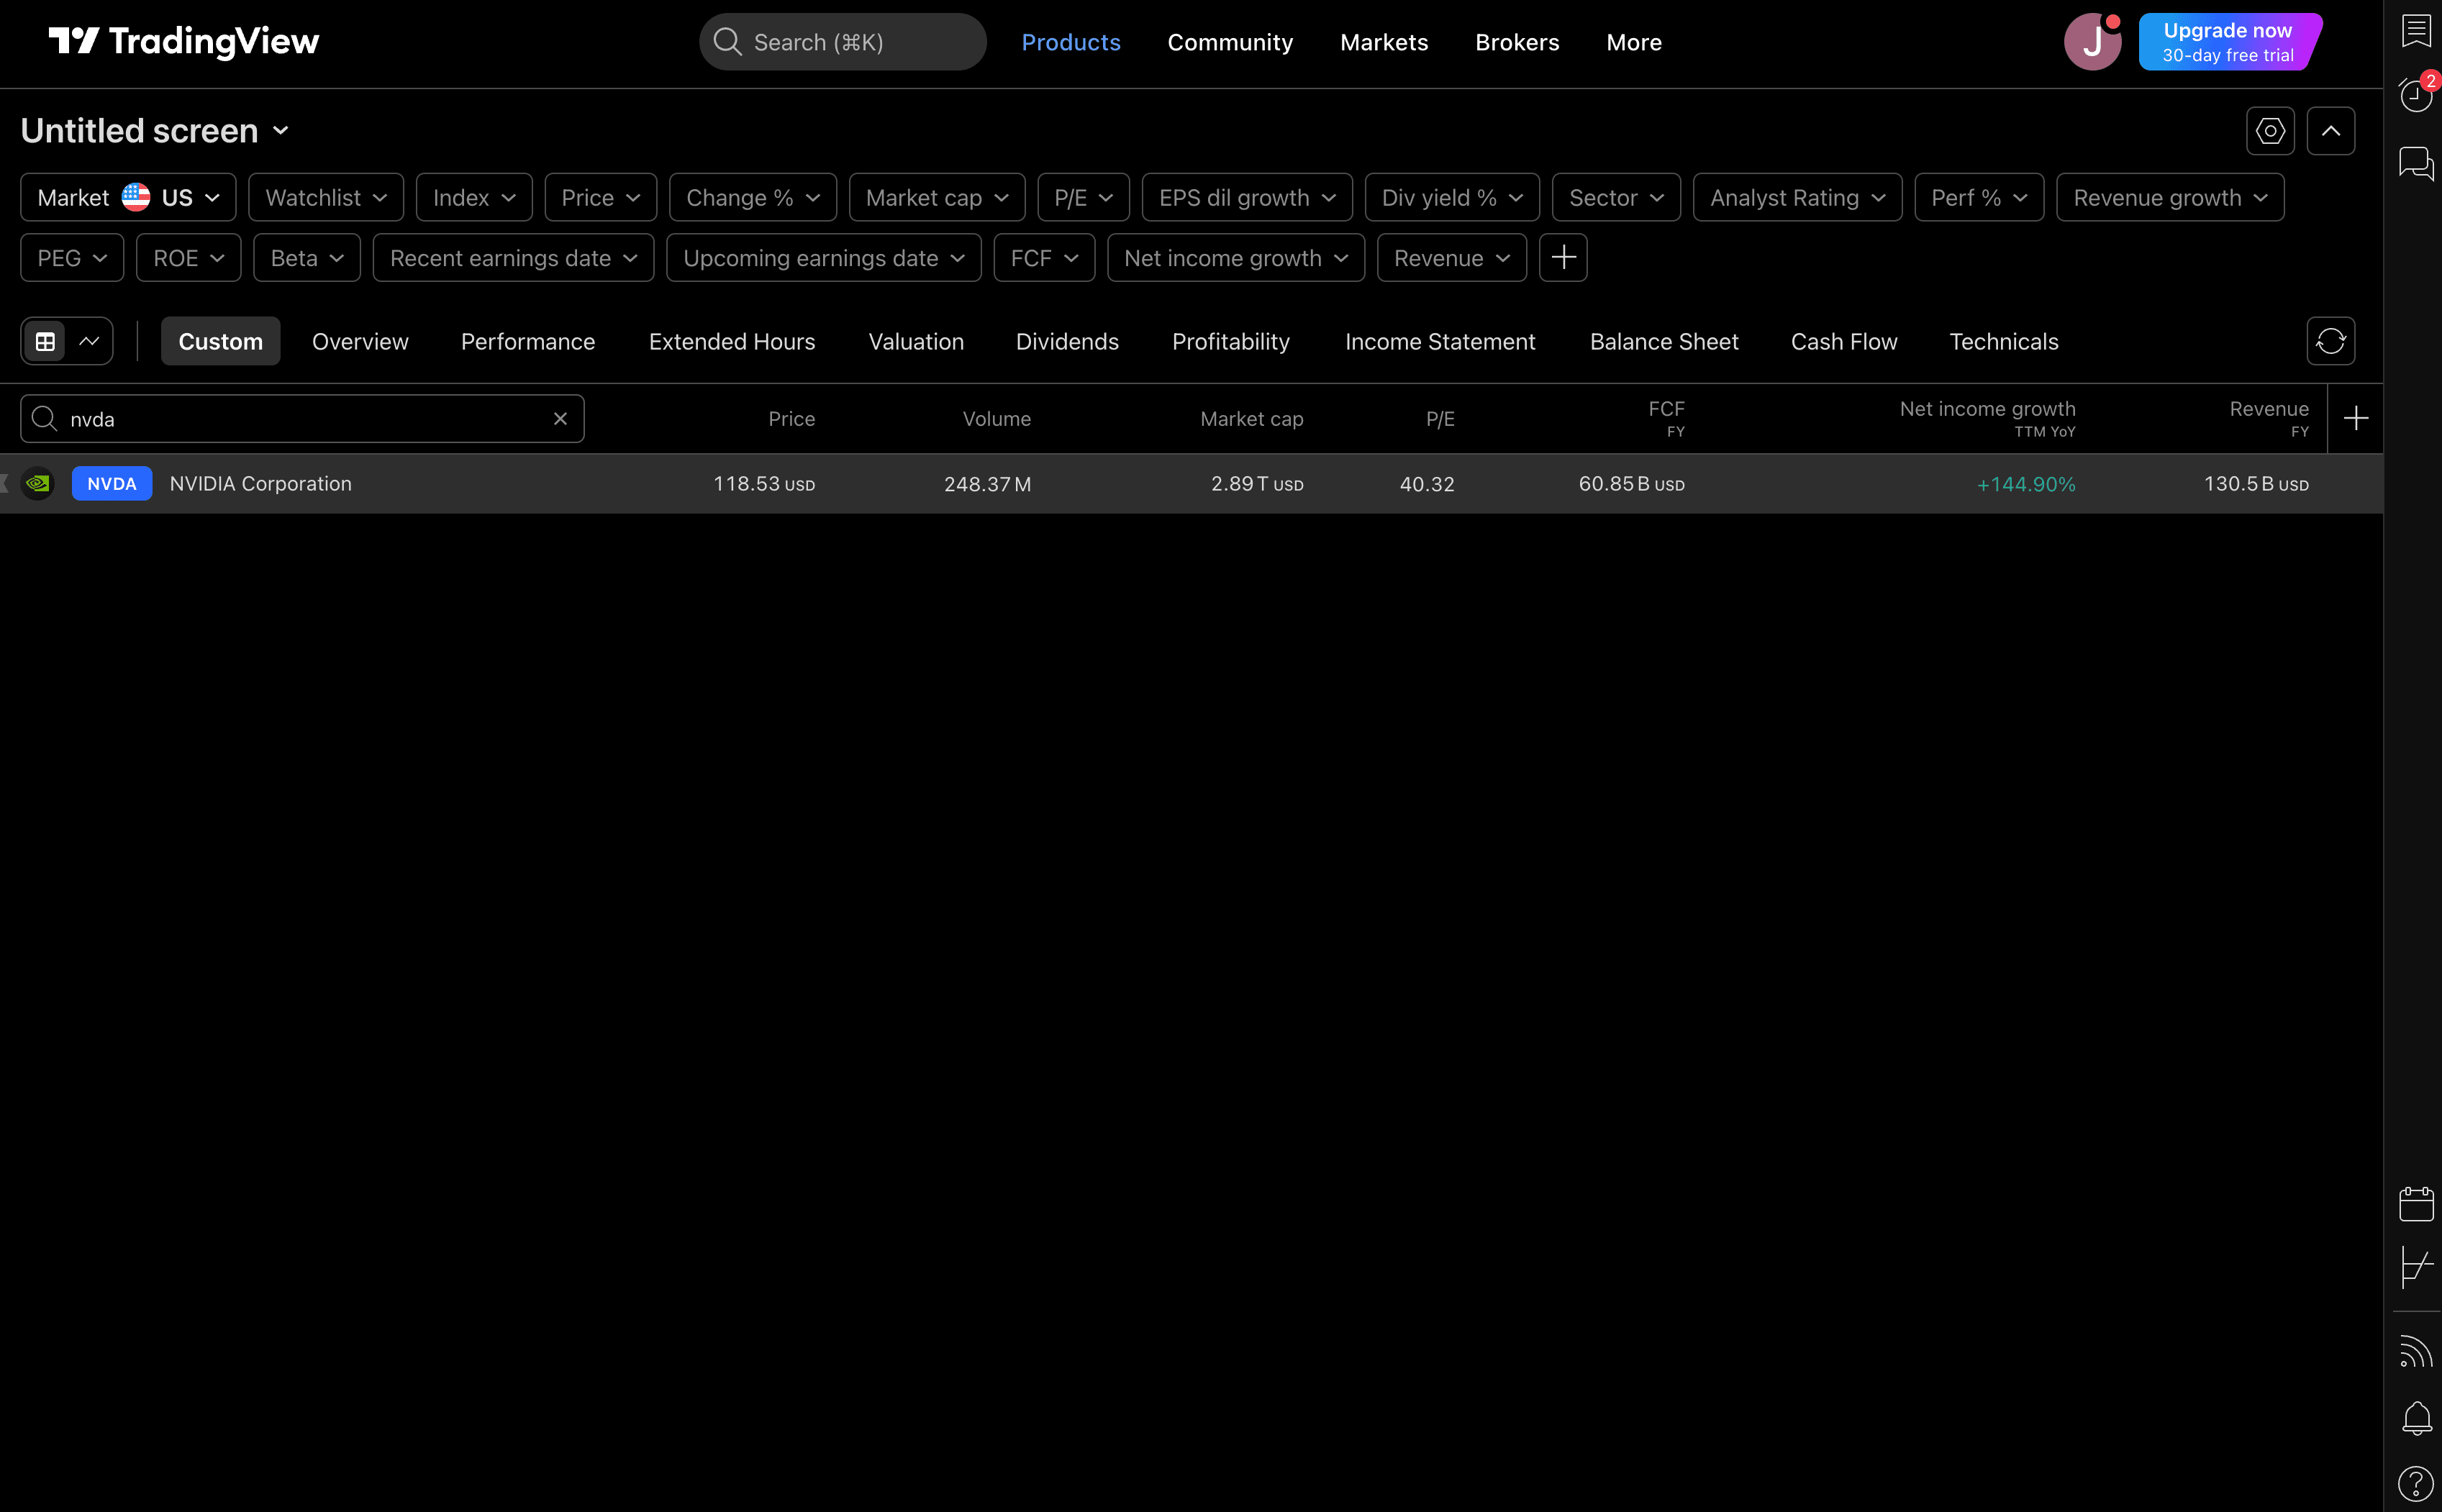
Screeners are powerful market scanning tools that help traders and investors filter stocks, forex pairs, and cryptocurrencies based on various technical and fundamental criteria. By applying customizable filters such as price, volume, moving averages, RSI, and market capitalization, users can quickly identify potential trading opportunities without manually analyzing numerous charts.
For example the stocks market screener provides real-time market data, built-in filter presets, and access to international markets. It allows you to efficiently identify potential investment opportunities, whether for long-term growth or short-term gains.
Stock Symbol
A stock symbol (also called a ticker symbol) is a unique combination of letters assigned to a publicly traded company's shares on a stock exchange. It serves as an identifier for investors and traders to quickly find and track specific stocks. You can navigate to the stock symbol page through your screener. Find a stock you want to learn more about and then click on the stock symbol in the row.
For example, a popular one at the moment is NVDA represents NVIDIA on the NASDAQ. Stock symbols can vary in length and format depending on the exchange. For instance, U.S. stocks typically have up to four letters, while some international markets may include numbers or extensions.
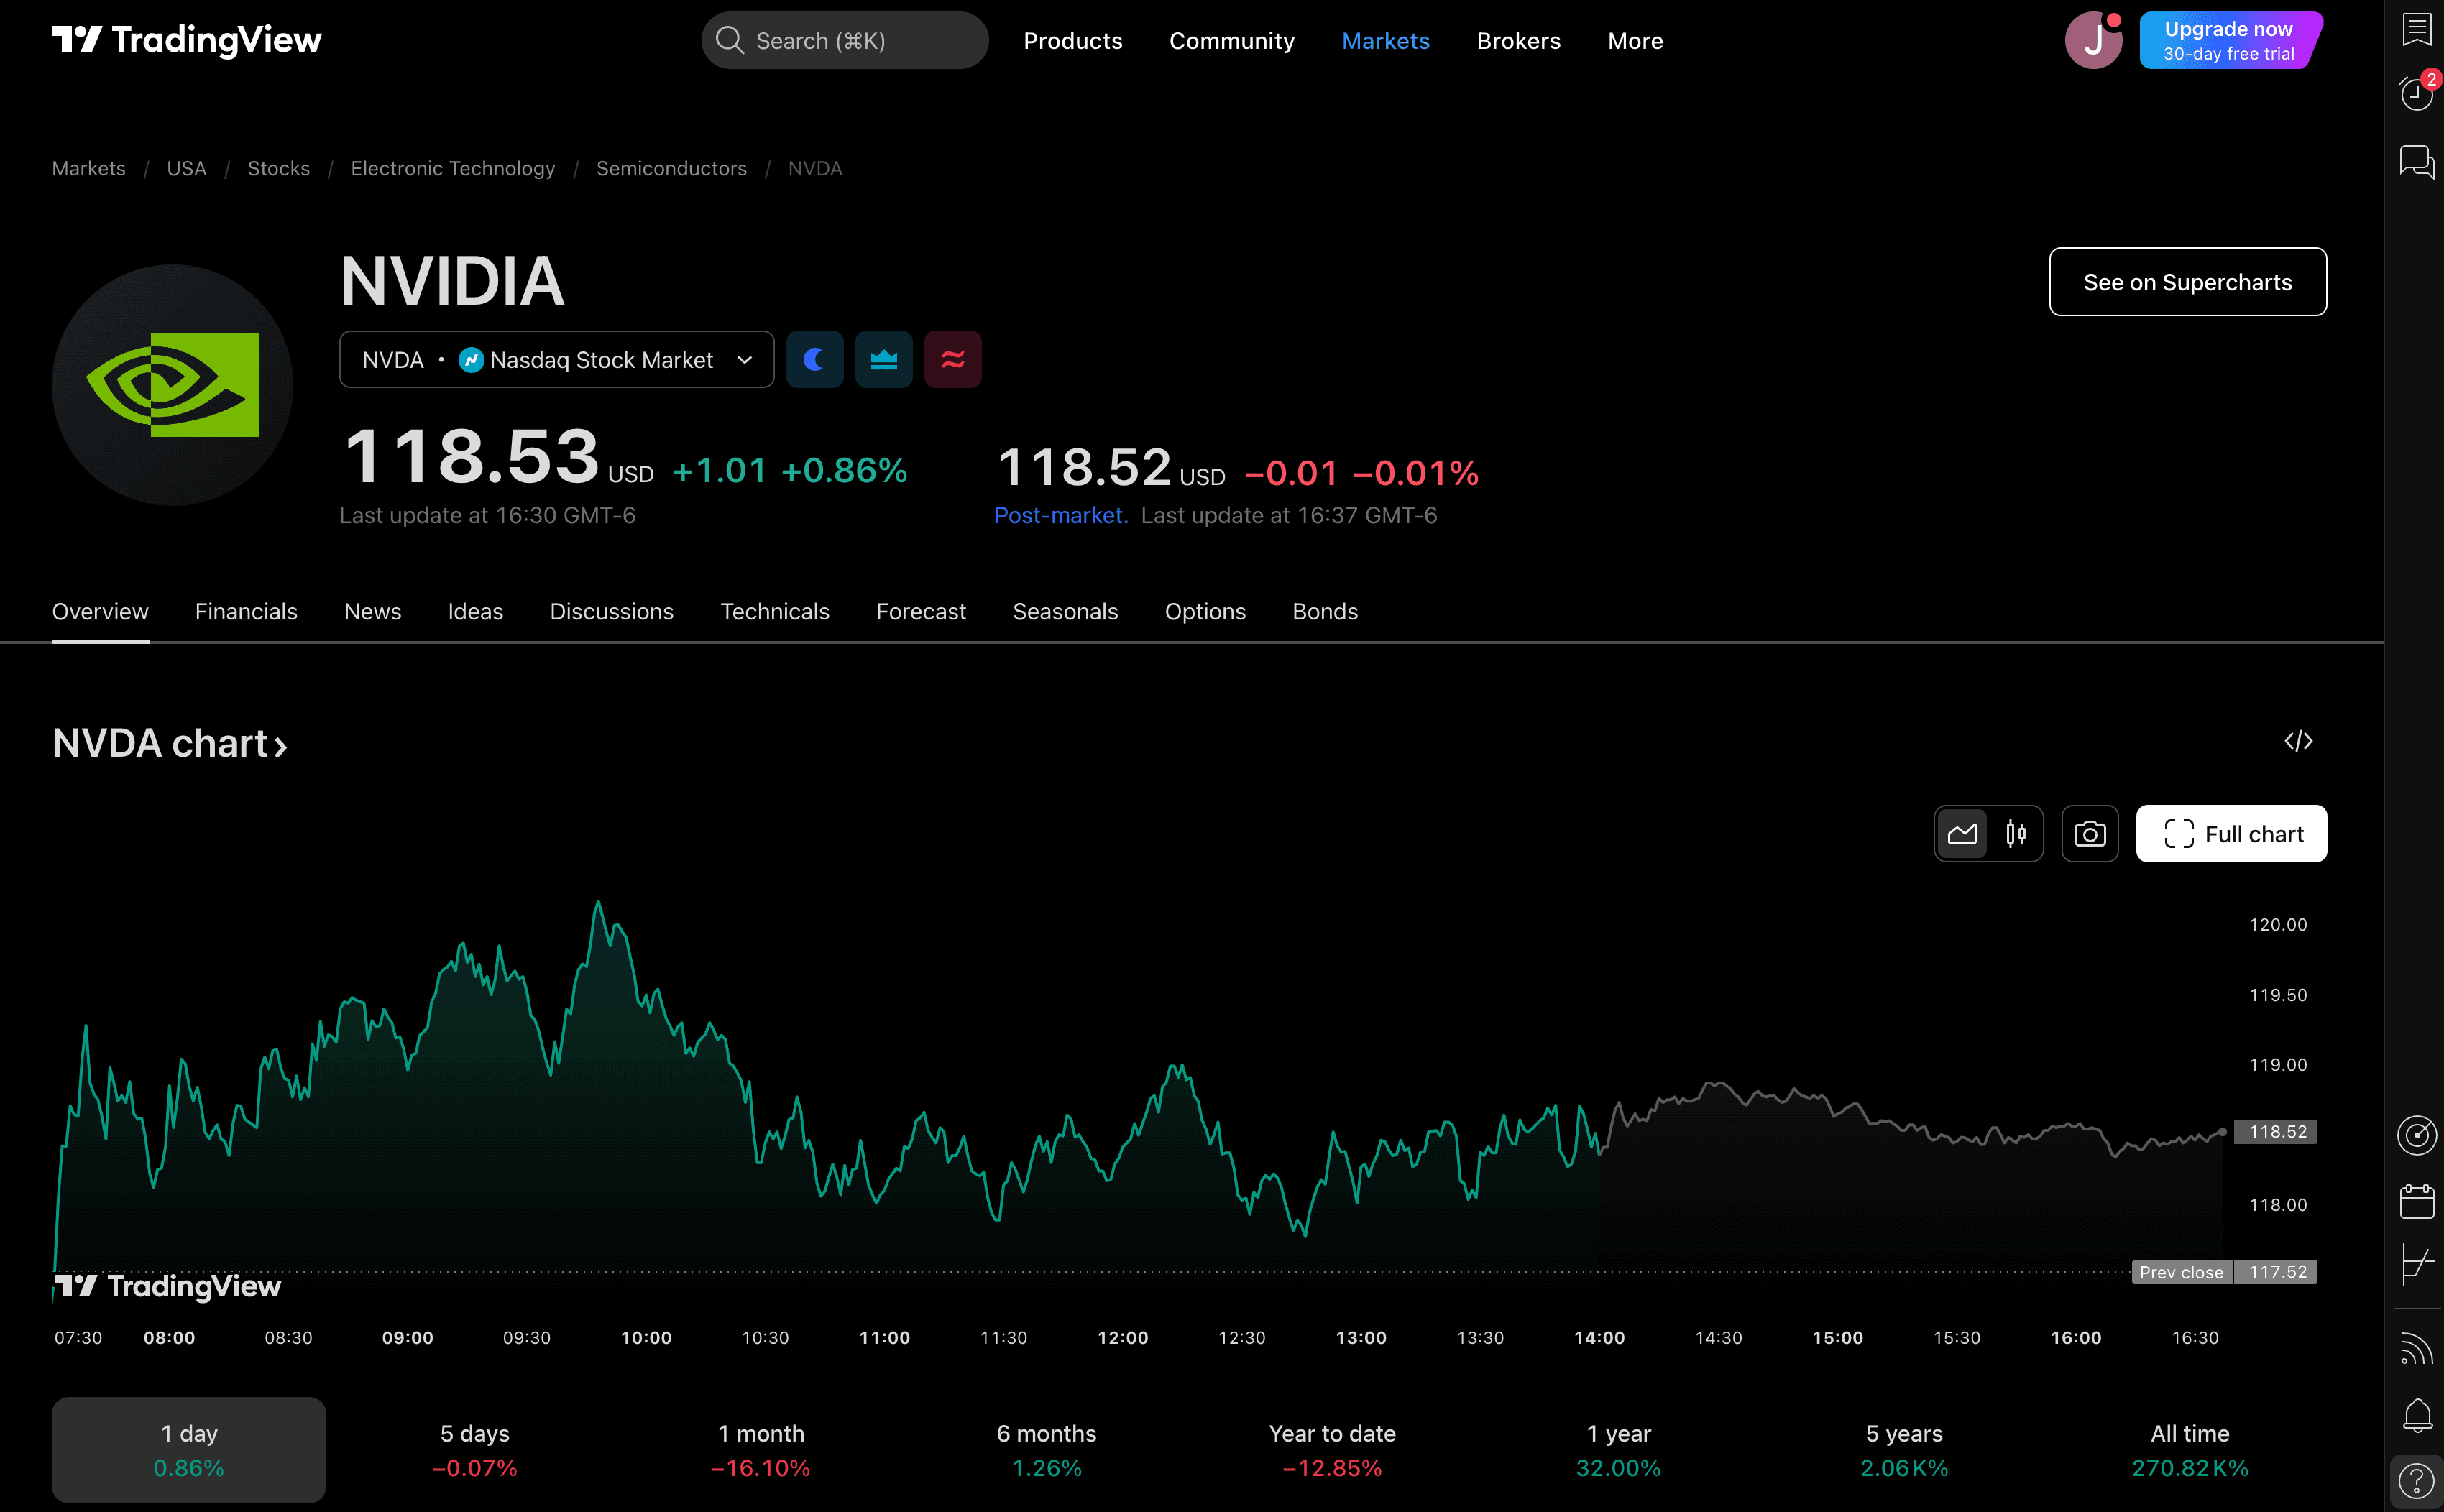
It shows a chart of its current day price in real time and gives you the ability to check its prior months to year performance. A quick way to look for patterns and trends. Along with the stock exchange for the stock symbol.
A stock exchange is a regulated marketplace where investors buy and sell securities such as stocks, bonds, and ETFs. It facilitates the trading of publicly listed companies, providing a transparent and structured environment for price discovery, liquidity, and investor protection. Major stock exchanges include the New York Stock Exchange (NYSE), NASDAQ, London Stock Exchange (LSE), and Tokyo Stock Exchange (TSE). These exchanges operate under strict regulations to ensure fair trading practices and stability in the financial markets. Companies list their stocks on exchanges to raise capital, while investors use them to trade and invest in businesses worldwide.
Clicking on the Financials tab navigates to the financial overview of the company. This provides key financial data and performance metrics of the company. You will see many pie charts and bar charts covering important metrics used to determine a company's performance quarterly and annually. If you don't understand a chart click on the question mark icon next to the chart title for more information.
News plays a significant role in influencing a company's stock price by shaping investor sentiment and market expectations. Positive news, such as strong earnings reports, product launches, mergers, or favorable economic data, can boost investor confidence, driving the stock price higher. Conversely, negative news, such as poor earnings, legal issues, regulatory actions, or economic downturns, can lead to panic selling and a decline in stock value. For the latest news click on the News tab.
Be sure to explore the other tabs!
Heatmaps
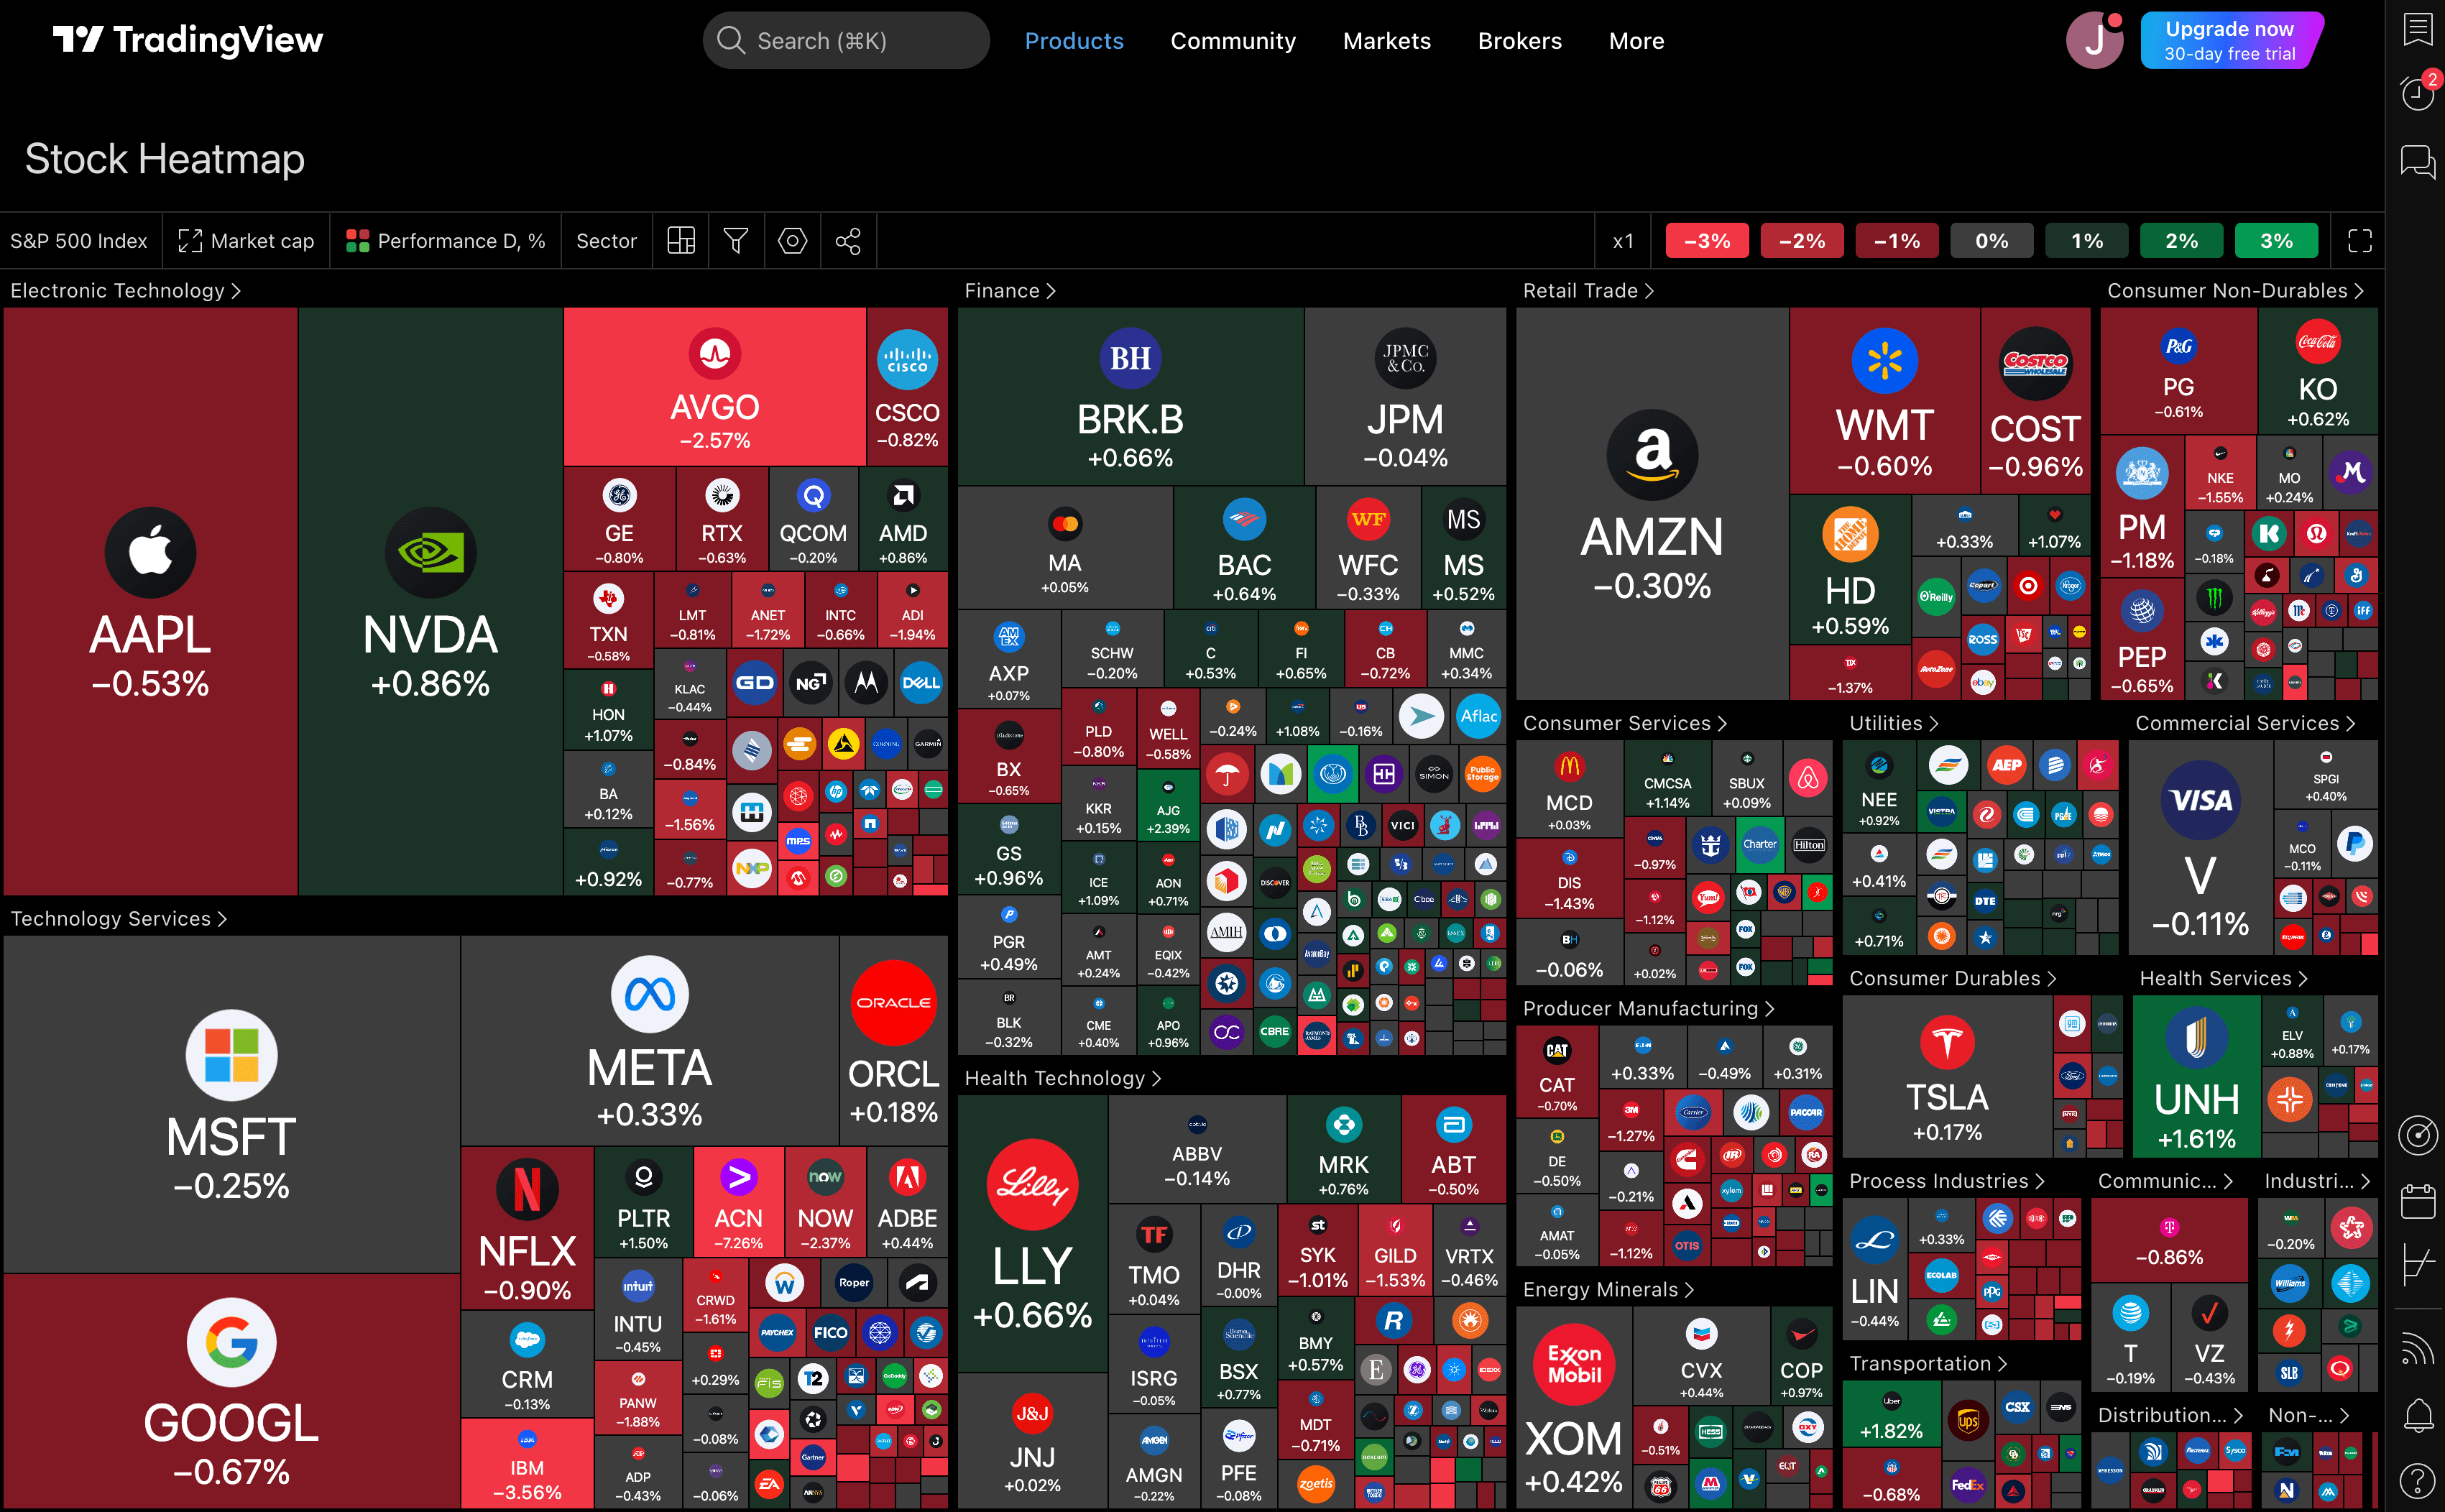
Heatmaps are visual tools that represent data using color gradients to highlight patterns, trends, or intensity levels within a dataset. In the financial world, heatmaps are commonly used to display market performance, showing stocks, sectors, or asset classes based on factors like price changes, volume, or relative strength.
For example, a stock market heatmap assigns colors like green for gains and red for losses to stocks, making it easy to spot trends across industries or indices. Darker shades often indicate stronger movements, helping traders quickly assess market sentiment and identify potential opportunities or risks. Heatmaps are valuable for both technical and fundamental analysis, offering an intuitive way to interpret complex data at a glance.
Supercharts
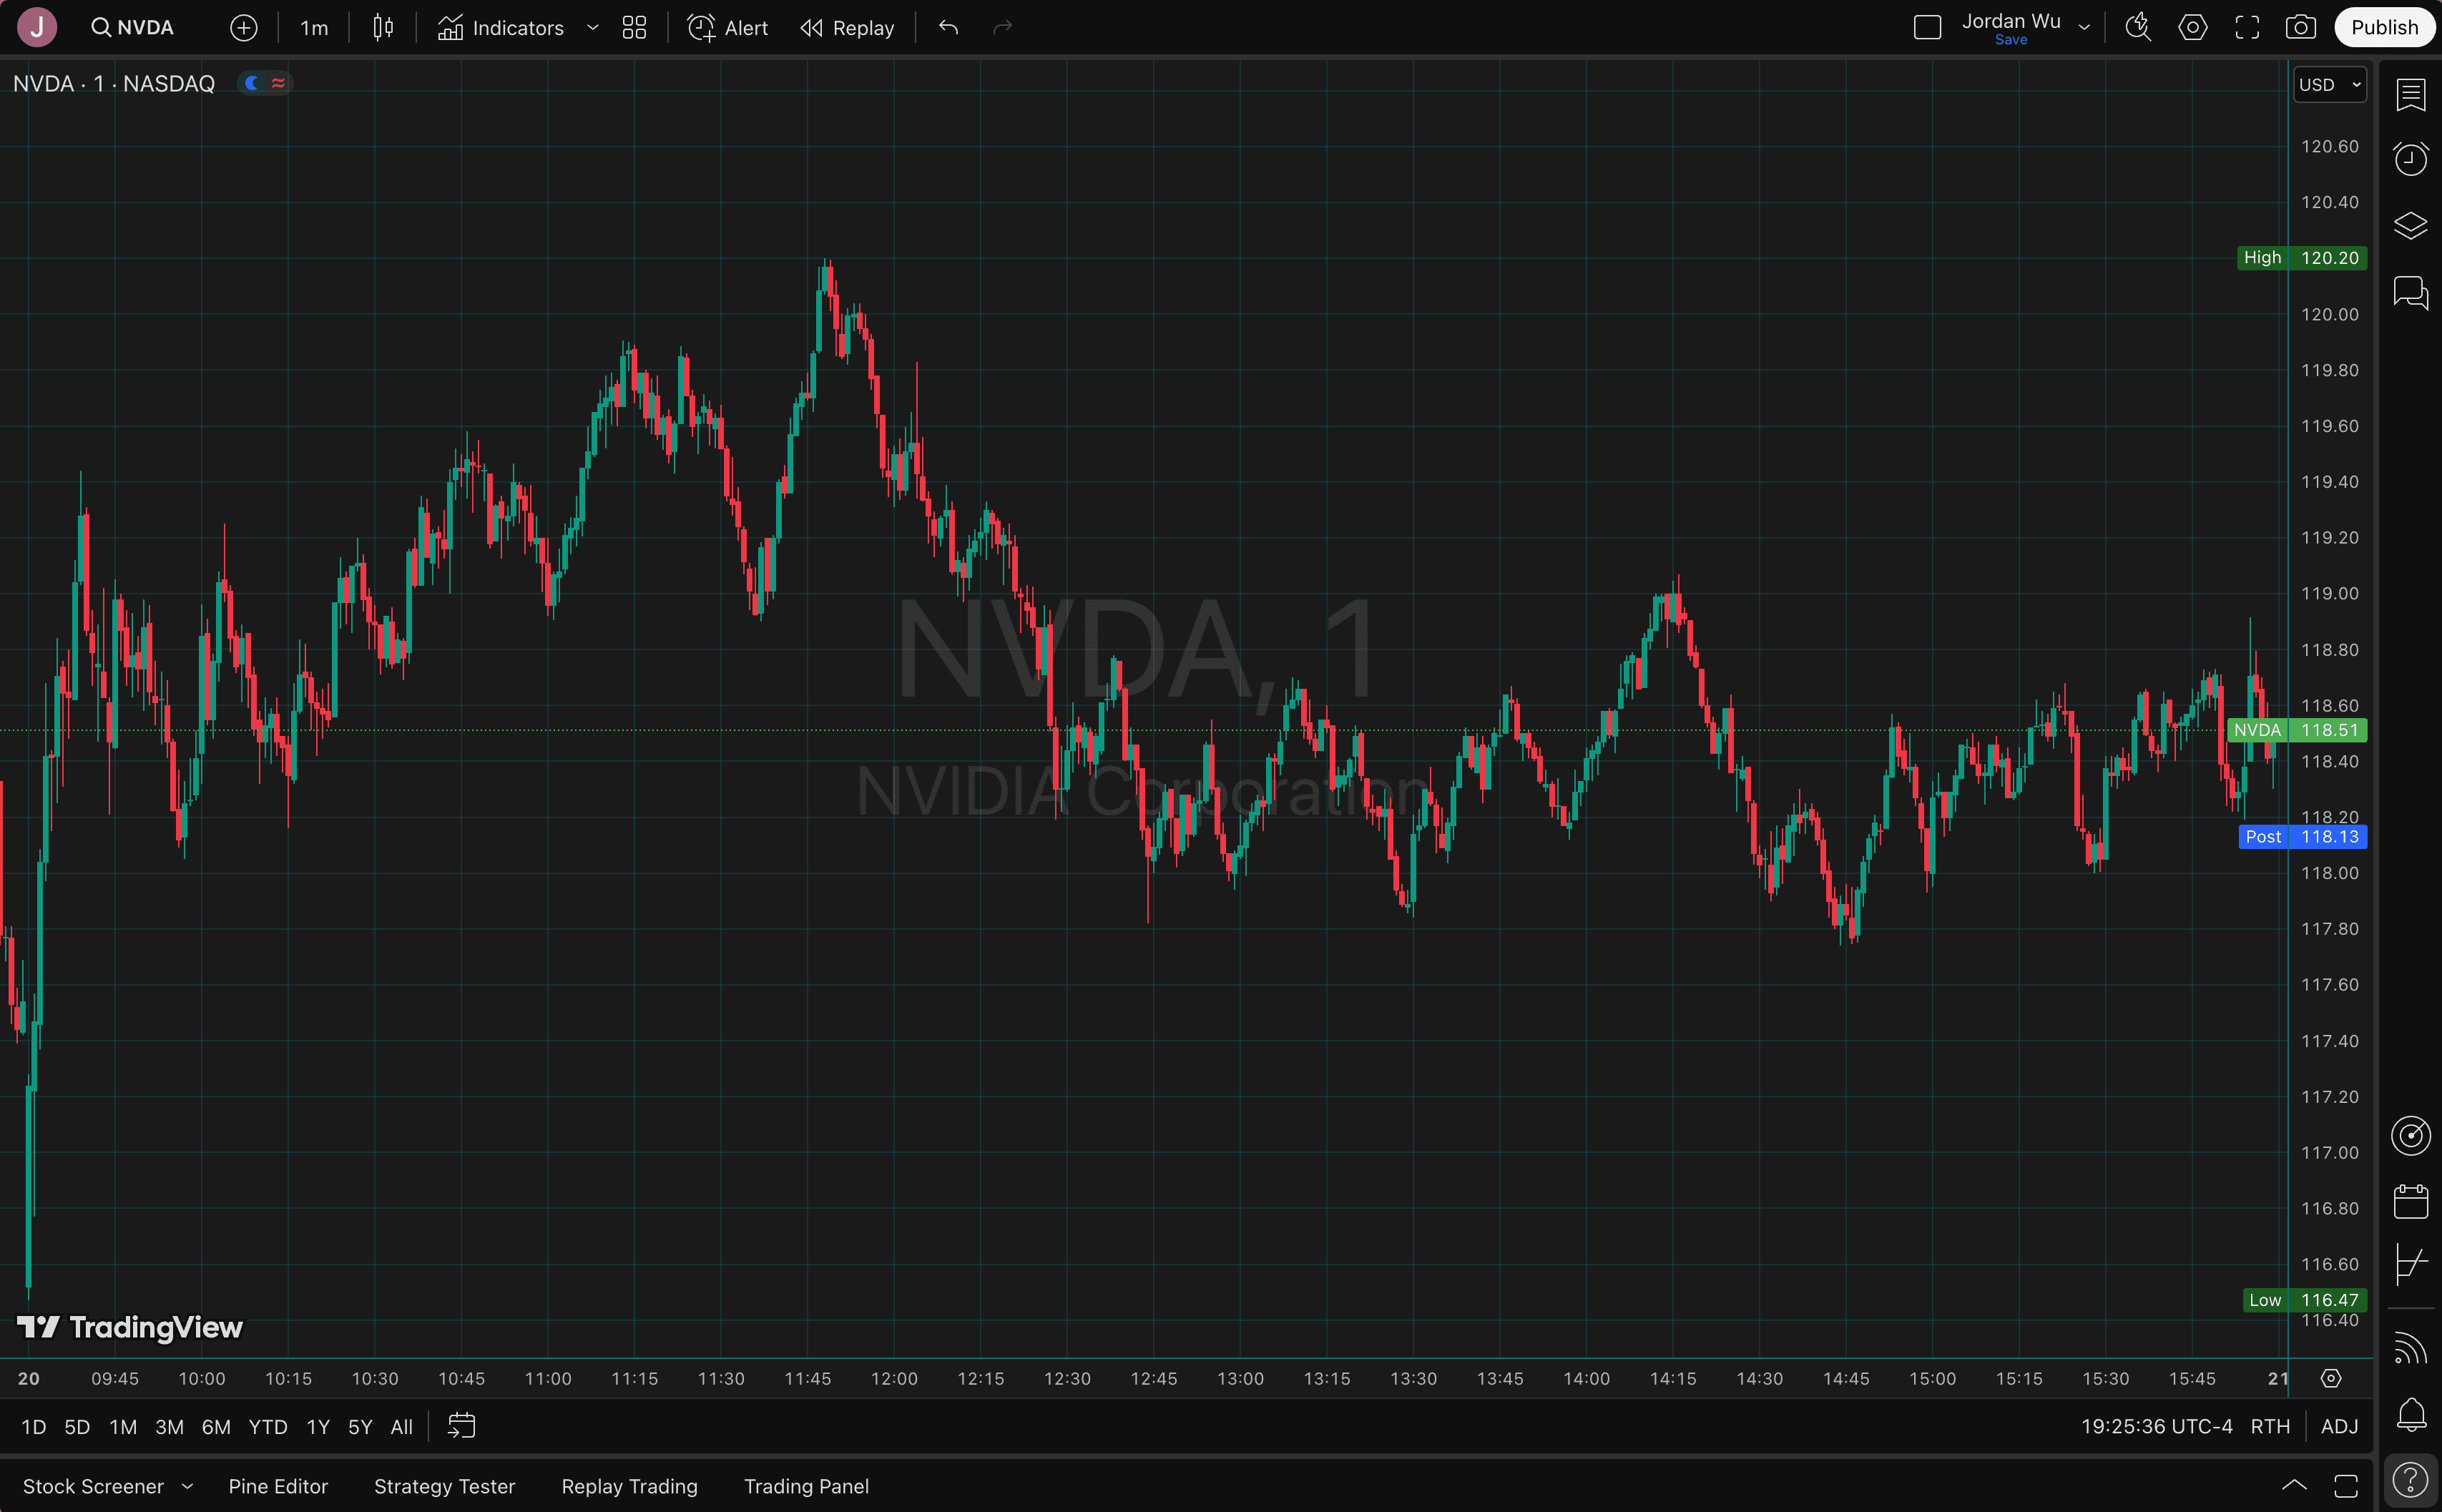
Supercharts (the one terminal to rule them all) is a fully customizable charting interface that provides traders with a highly interactive and feature-rich experience. These charts allow users to analyze price in real time, apply technical indicators, and customize their view to suit their trading strategies.
For example, the NVDA Superchart shows a chart for NVDA for the day.
Technical Indicators
Technical indicators are mathematical calculations derived from a stock's price, volume, or open interest, helping traders analyze market trends and make informed decisions. These tools are used to identify patterns, momentum, volatility, and potential reversals in price movements. Common types include trend indicators like Moving Average Exponential, Volume, and Moving Average Convergence Divergence (MACD). By combining multiple indicators, traders can develop strategies, confirm trade signals, and reduce risk, making technical analysis a key component of successful trading.
How to Create Your Own Technical Indicators
On the basic plan for TradingView it limits the number of technical indicators you can have per chat. However you can have more indicators by creating your own in Pine Script. In this example we will create a basic script to add three Moving Average Exponential indicators to our chat.
A moving average (MA) reflects the average value of data in its time window. A 5-day MA shows the average price for the past 5 days, a 20-day MA for the past 20 days, and so on. Connecting each day's MA value gives you a moving average line. A moving average represents an average consensus of value for the period of time in its window. The most important message of a moving average is the direction of its slope. When it rises, it shows that the crowd is becoming more optimistic (bullish). When it falls, it shows that the crowd is becoming more pessimistic (bearish). When prices rise above a moving average, the crowd is more bullish than before. When prices fall below a moving average, the crowd is more bearish than before.
An exponential moving average (EMA) is a better trend-following tool because it gives greater weight to the latest data and responds to changes faster than a simple MA. Faster reaction to price changes, making it useful for short-term traders by reducing lag compared to MA. This helps traders spot trends earlier and is effective for volatile markets, as it adapts quickly to new price data.
You can take several approaches to deciding how long to make your moving average. A 200-day moving average works for long-term stock investors who want to ride major trends. Most traders can use an EMA between 10 and 30 days. A moving average should not be shorter than 8 days to avoid defeating its purpose as a trend-following tool. Let's use 22-days because there are approximately 22 trading days in a month and let's use 26-days because it's half of the number of trading weeks in a year. You can use whatever you want. There is no best number for the EMA window.
Open the Pine Script Editor and paste in the following code.
// This Pine Script™ code is subject to the terms of the Mozilla Public License 2.0 at https://mozilla.org/MPL/2.0/
// © jordan_wu
//@version=6
indicator(title="jordanwu.xyz", shorttitle="jordanwu.xyz", overlay=true, timeframe="", timeframe_gaps=true)
// Moving Average Exponential 22, 26, 200
offset = 0
len = 22
src = close
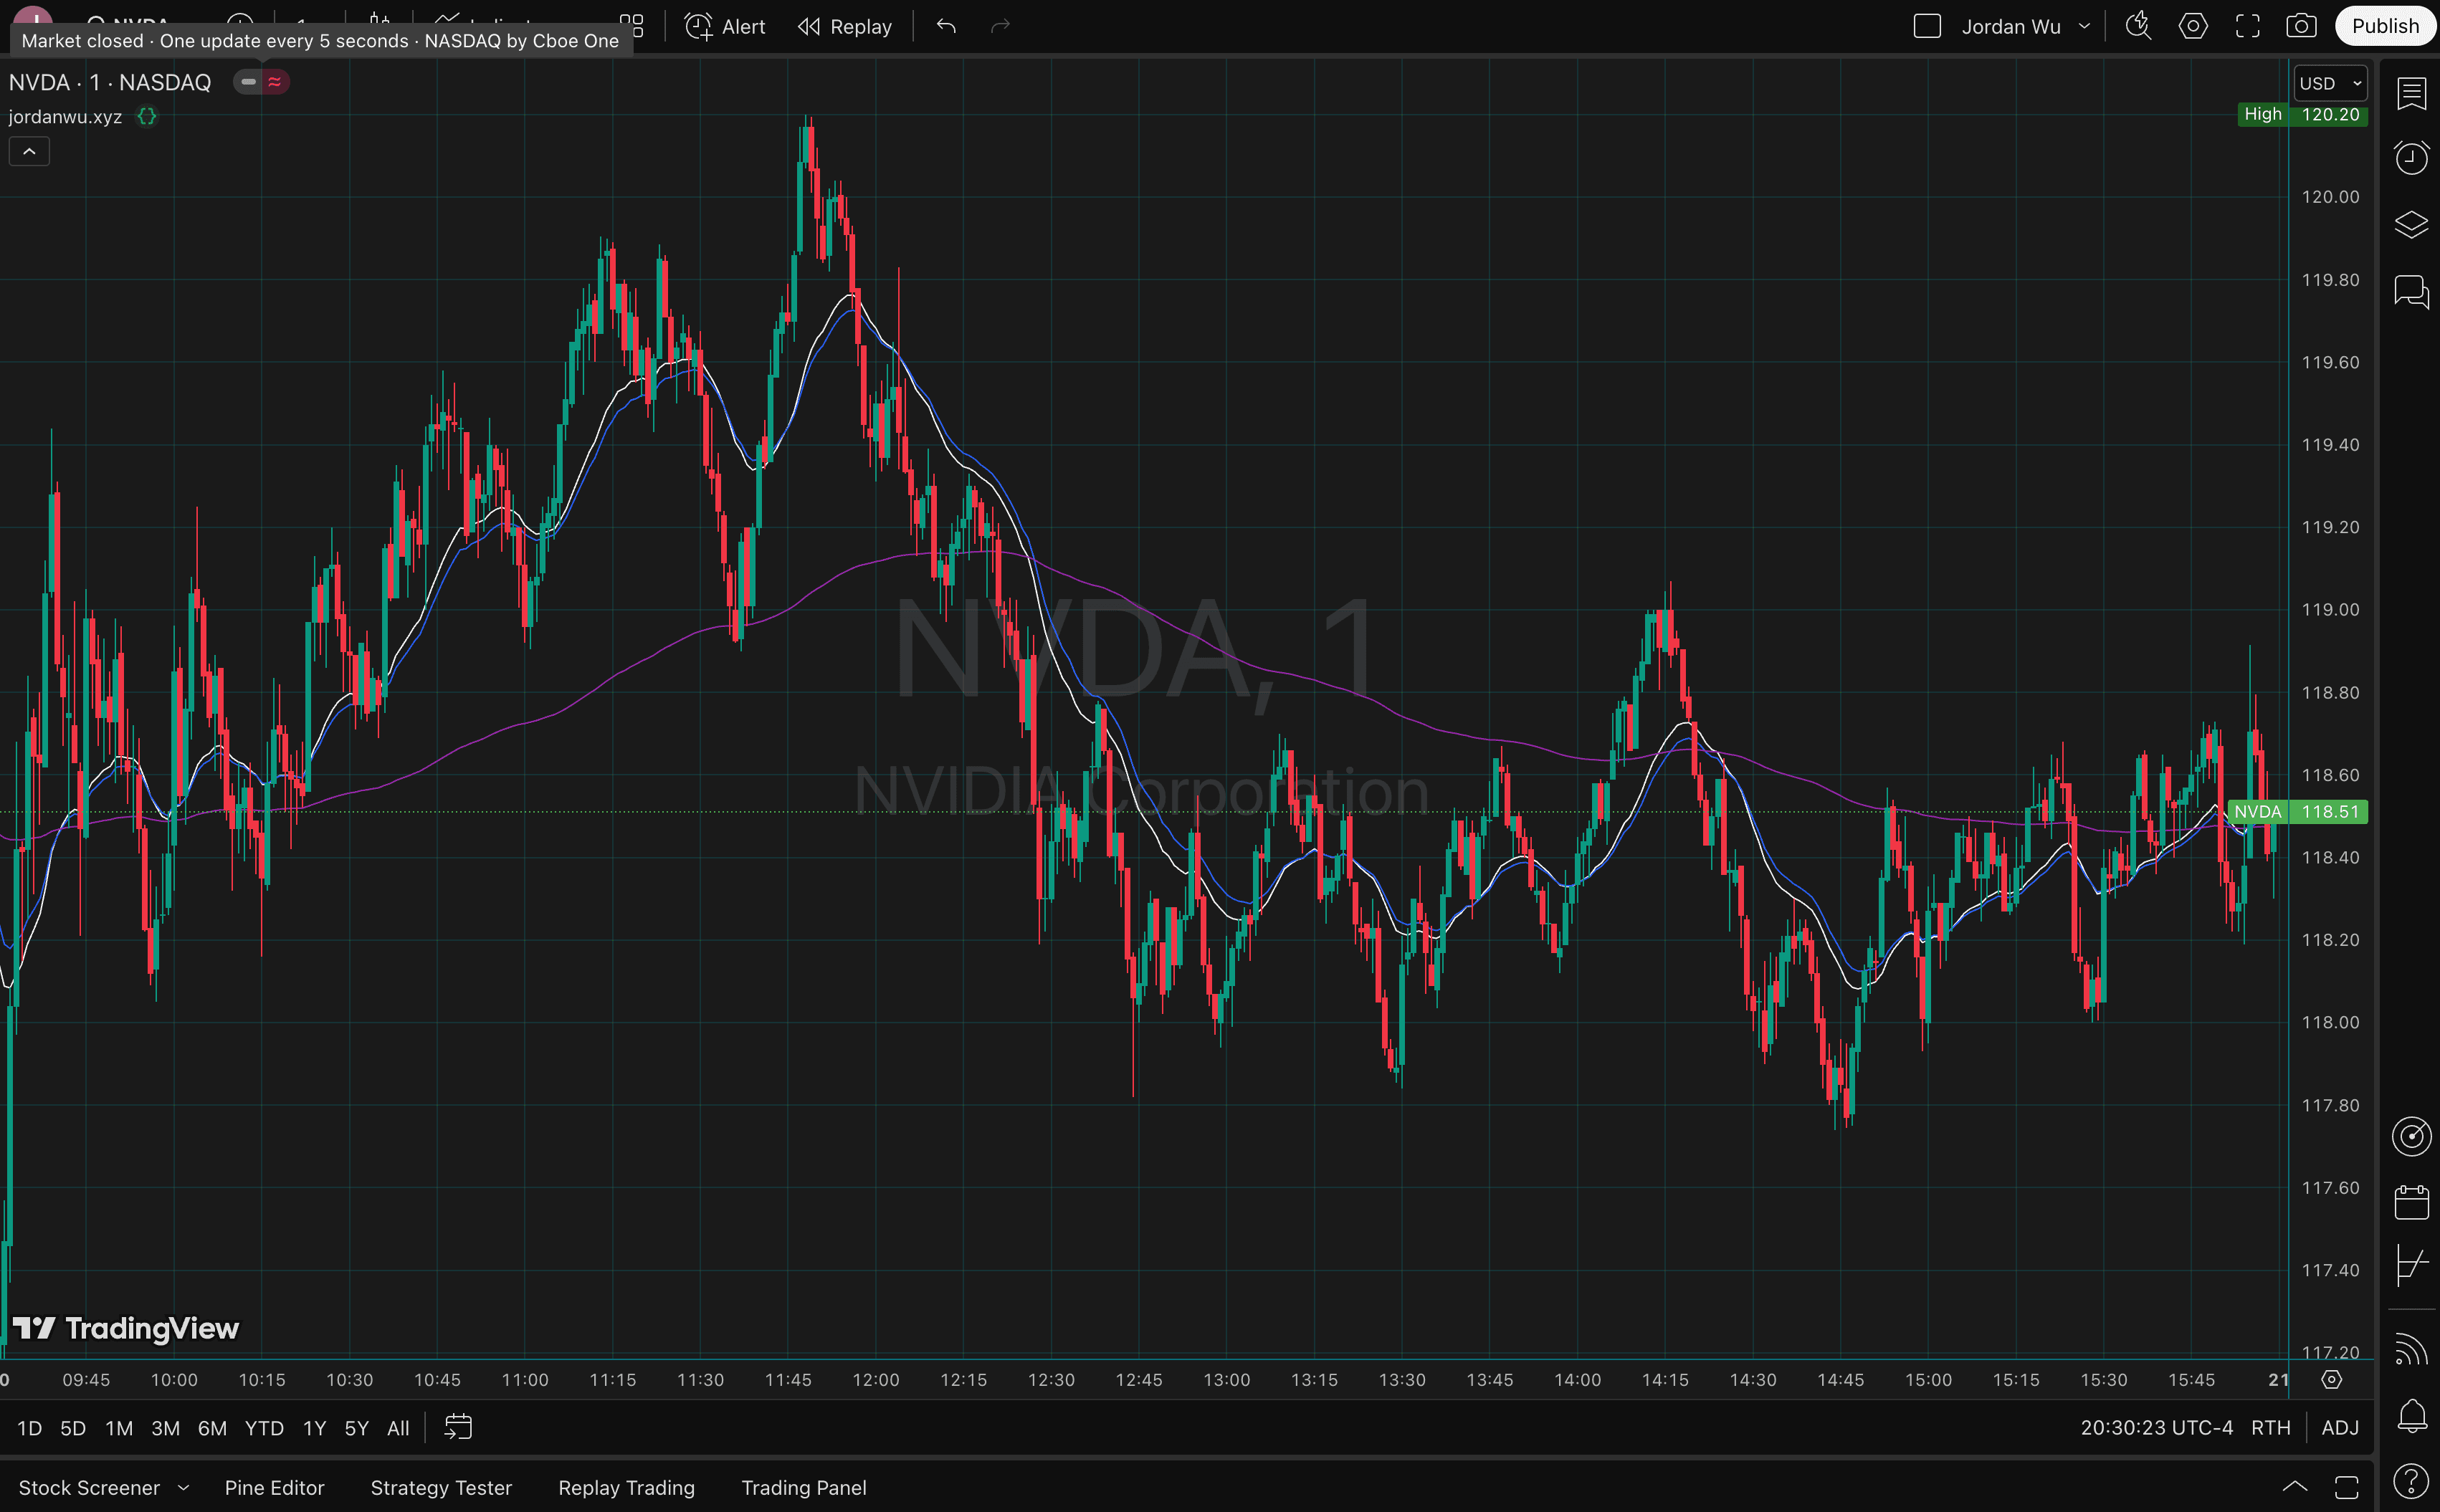
out = ta.ema(src, len)
plot(out, title="EMA 22", color=color.white, offset=offset)
len := input.int(26, minval=1, title="Length")
src := input(close, title="Source")
out := ta.ema(src, len)
plot(out, title="EMA 26", color=color.blue, offset=offset)
len := input.int(200, minval=1, title="Length")
src := input(close, title="Source")
out := ta.ema(src, len)
plot(out, title="EMA 200", color=color.purple, offset=offset)
The following code uses the existing Pine Script EMA function which takes in a source and length.
The most common sources in Pine Script include data:
- close: Closing price of a bar (most commonly used).
- open: Opening price of a bar.
- high: Highest price of a bar.
- low: Lowest price of a bar.
- hl2: (High + Low) / 2, useful for smoothing.
- hlc3: (High + Low + Close) / 3, often used in calculations.
- ohlc4: (Open + High + Low + Close) / 4, a more balanced price source.
- volume: The volume of a particular bar.
The source we are using is the close and the length will be based on the days we decided to use 22, 26, and 200. Once we calculated our ema value we then will call the plot function to plot it to the chart.
That is how you can create your own technical indicators in TradingView. Pine Script allows you to create your own technical indicator to use with your strategy and allows you to add more indicators on the basic plan.
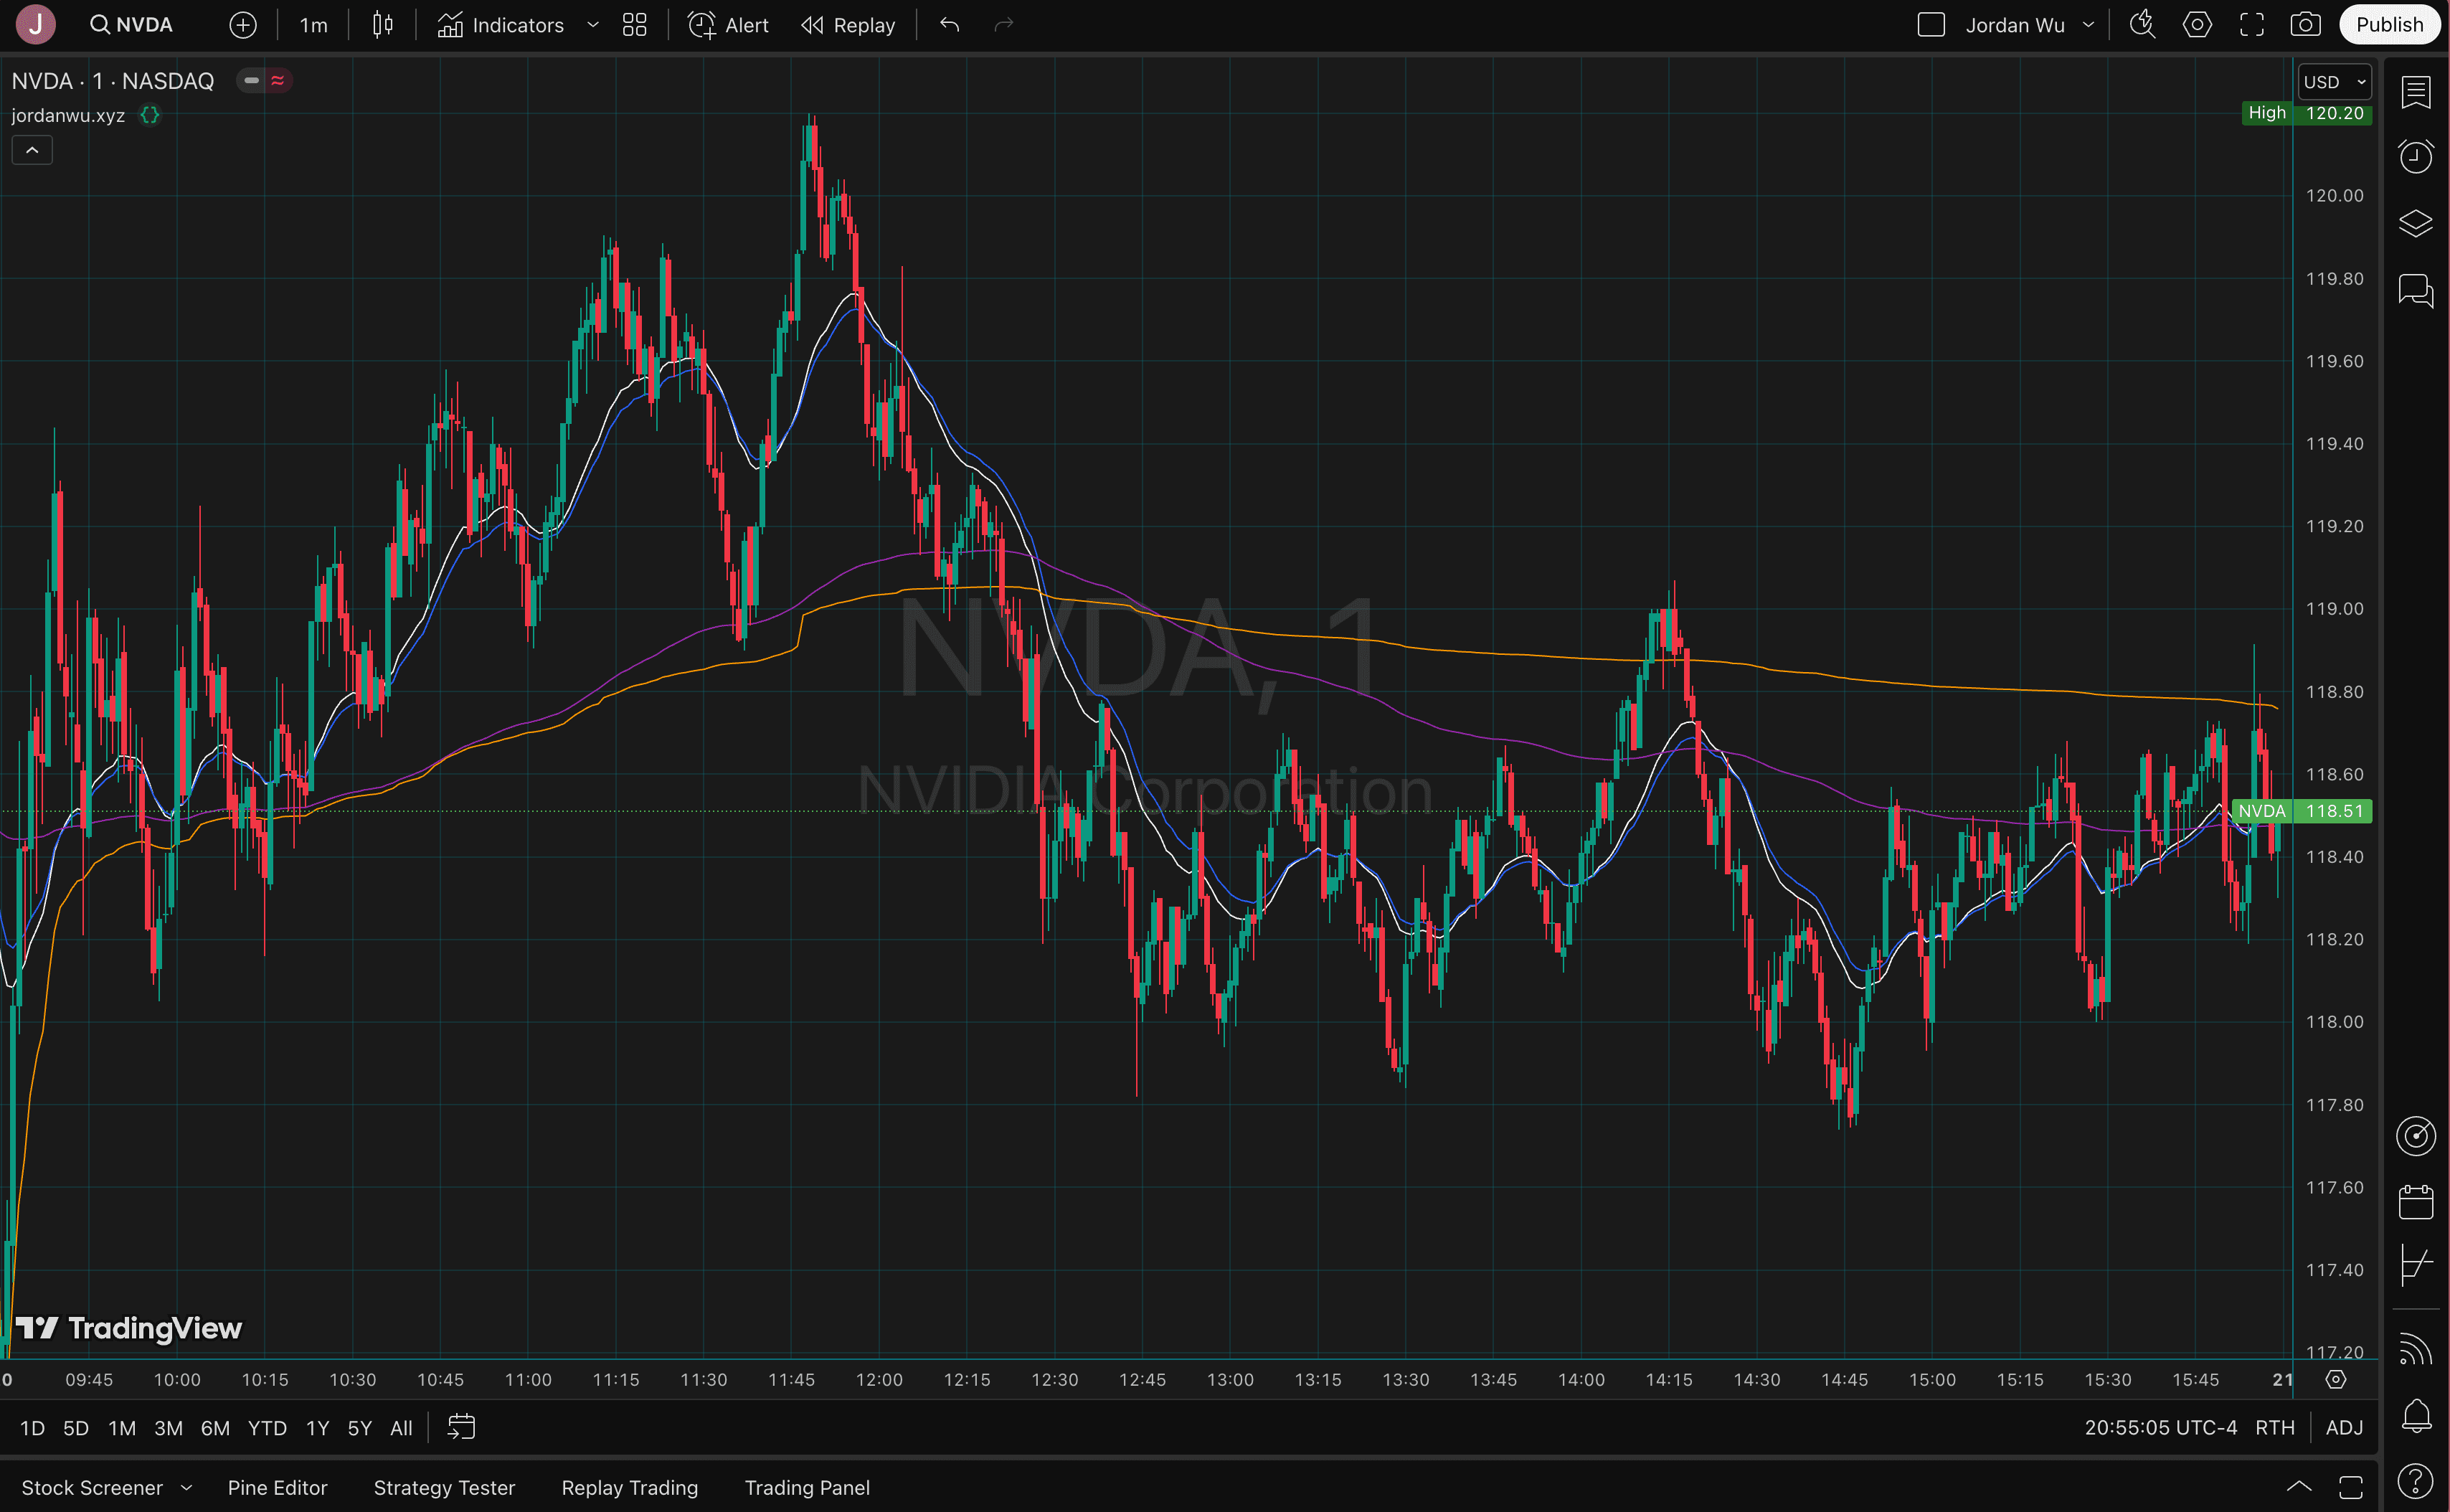
Here's another example of including the Volume Weighted Average Price (VWAP) technical indicator to your chart. VWAP is a technical analysis tool that helps traders understand the average price of a security, taking into account both price and volume.
// This Pine Script™ code is subject to the terms of the Mozilla Public License 2.0 at https://mozilla.org/MPL/2.0/
// © jordan_wu

//@version=6
indicator(title="jordanwu.xyz", shorttitle="jordanwu.xyz", overlay=true, timeframe="", timeframe_gaps=true)

// Moving Average Exponential 22, 26, 200

offset = 0
len = 22
src = close
out = ta.ema(src, len)
plot(out, title="EMA 22", color=color.white, offset=offset)

len := input.int(26, minval=1, title="Length")
src := input(close, title="Source")
out := ta.ema(src, len)
plot(out, title="EMA 26", color=color.blue, offset=offset)

len := input.int(200, minval=1, title="Length")
src := input(close, title="Source")
out := ta.ema(src, len)
plot(out, title="EMA 200", color=color.purple, offset=offset)

// Volume Weighted Average Price

hideonDWM = true
src := hlc3
offset := 0

cumVolume = ta.cum(volume)
if barstate.islast and cumVolume == 0
    runtime.error("No volume is provided by the data vendor.")

isNewPeriod = timeframe.change("D")

isEsdAnchor = false
if na(src[1]) and not isEsdAnchor
	isNewPeriod := true

float vwapValue = na

if not (hideonDWM and timeframe.isdwm)
    [_vwap, _stdevUpper, _] = ta.vwap(src, isNewPeriod, 1)
	vwapValue := _vwap

plot(vwapValue, title = "VWAP", color = color.orange, offset = offset)
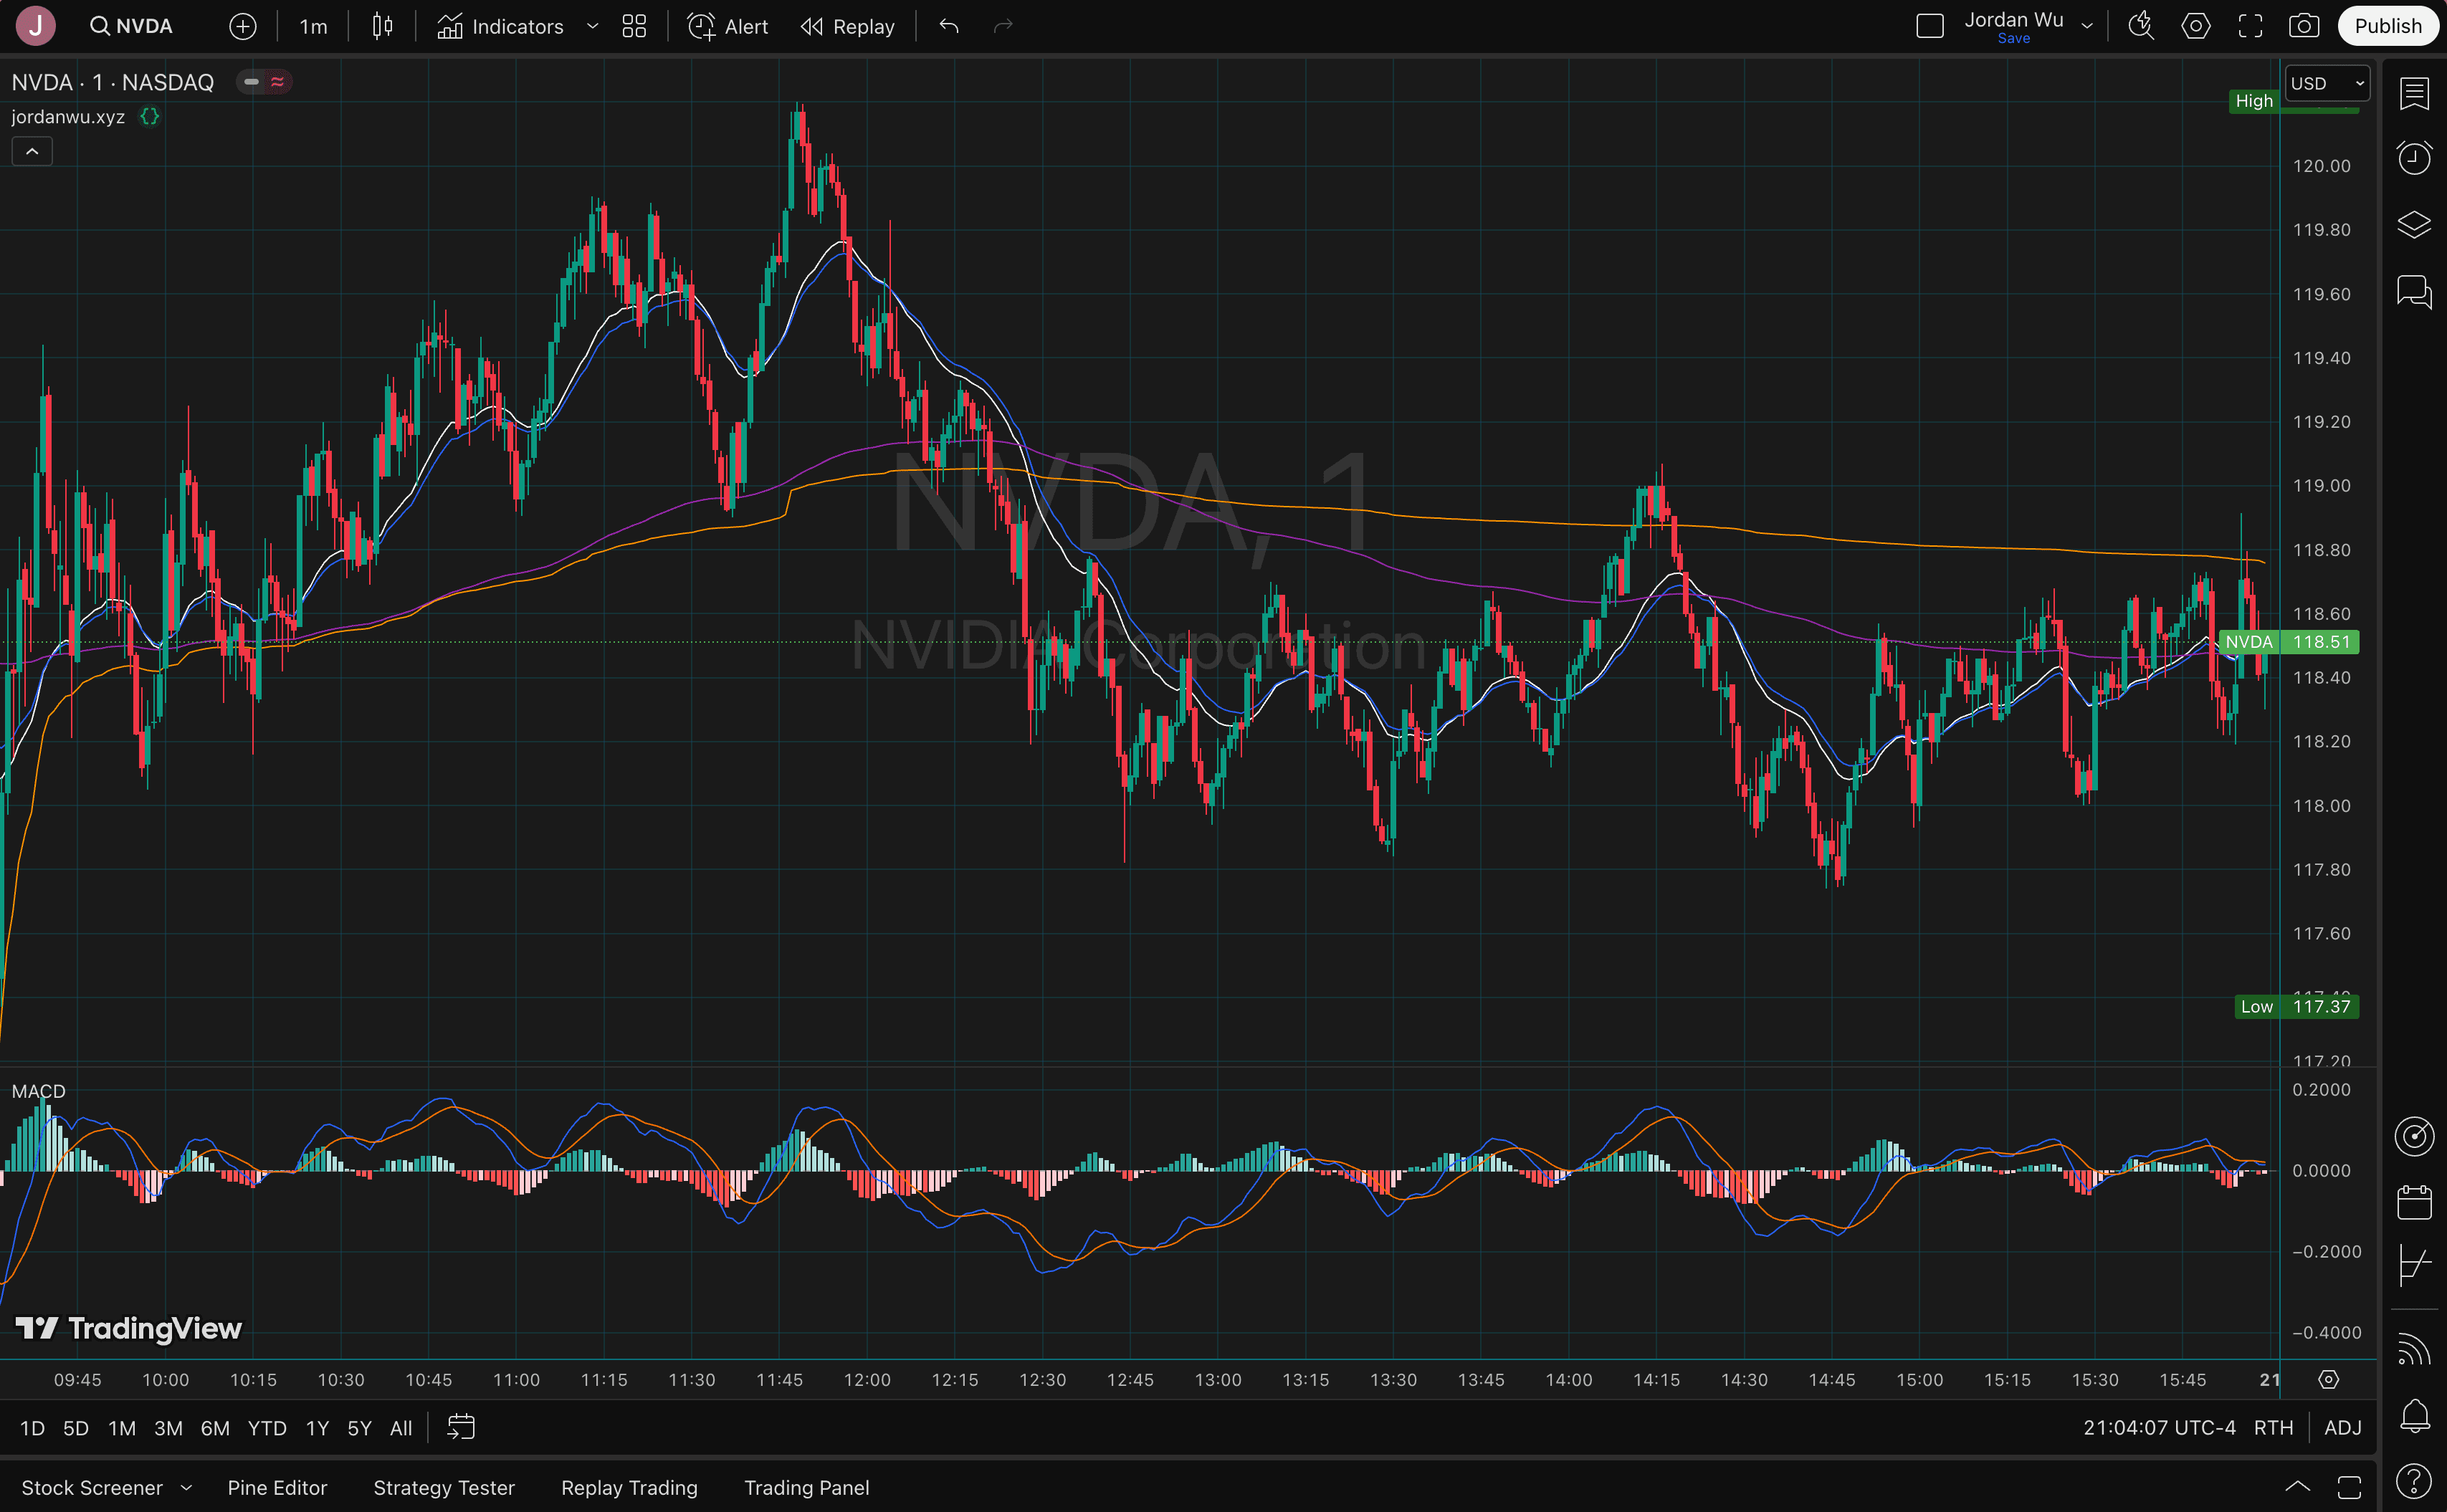
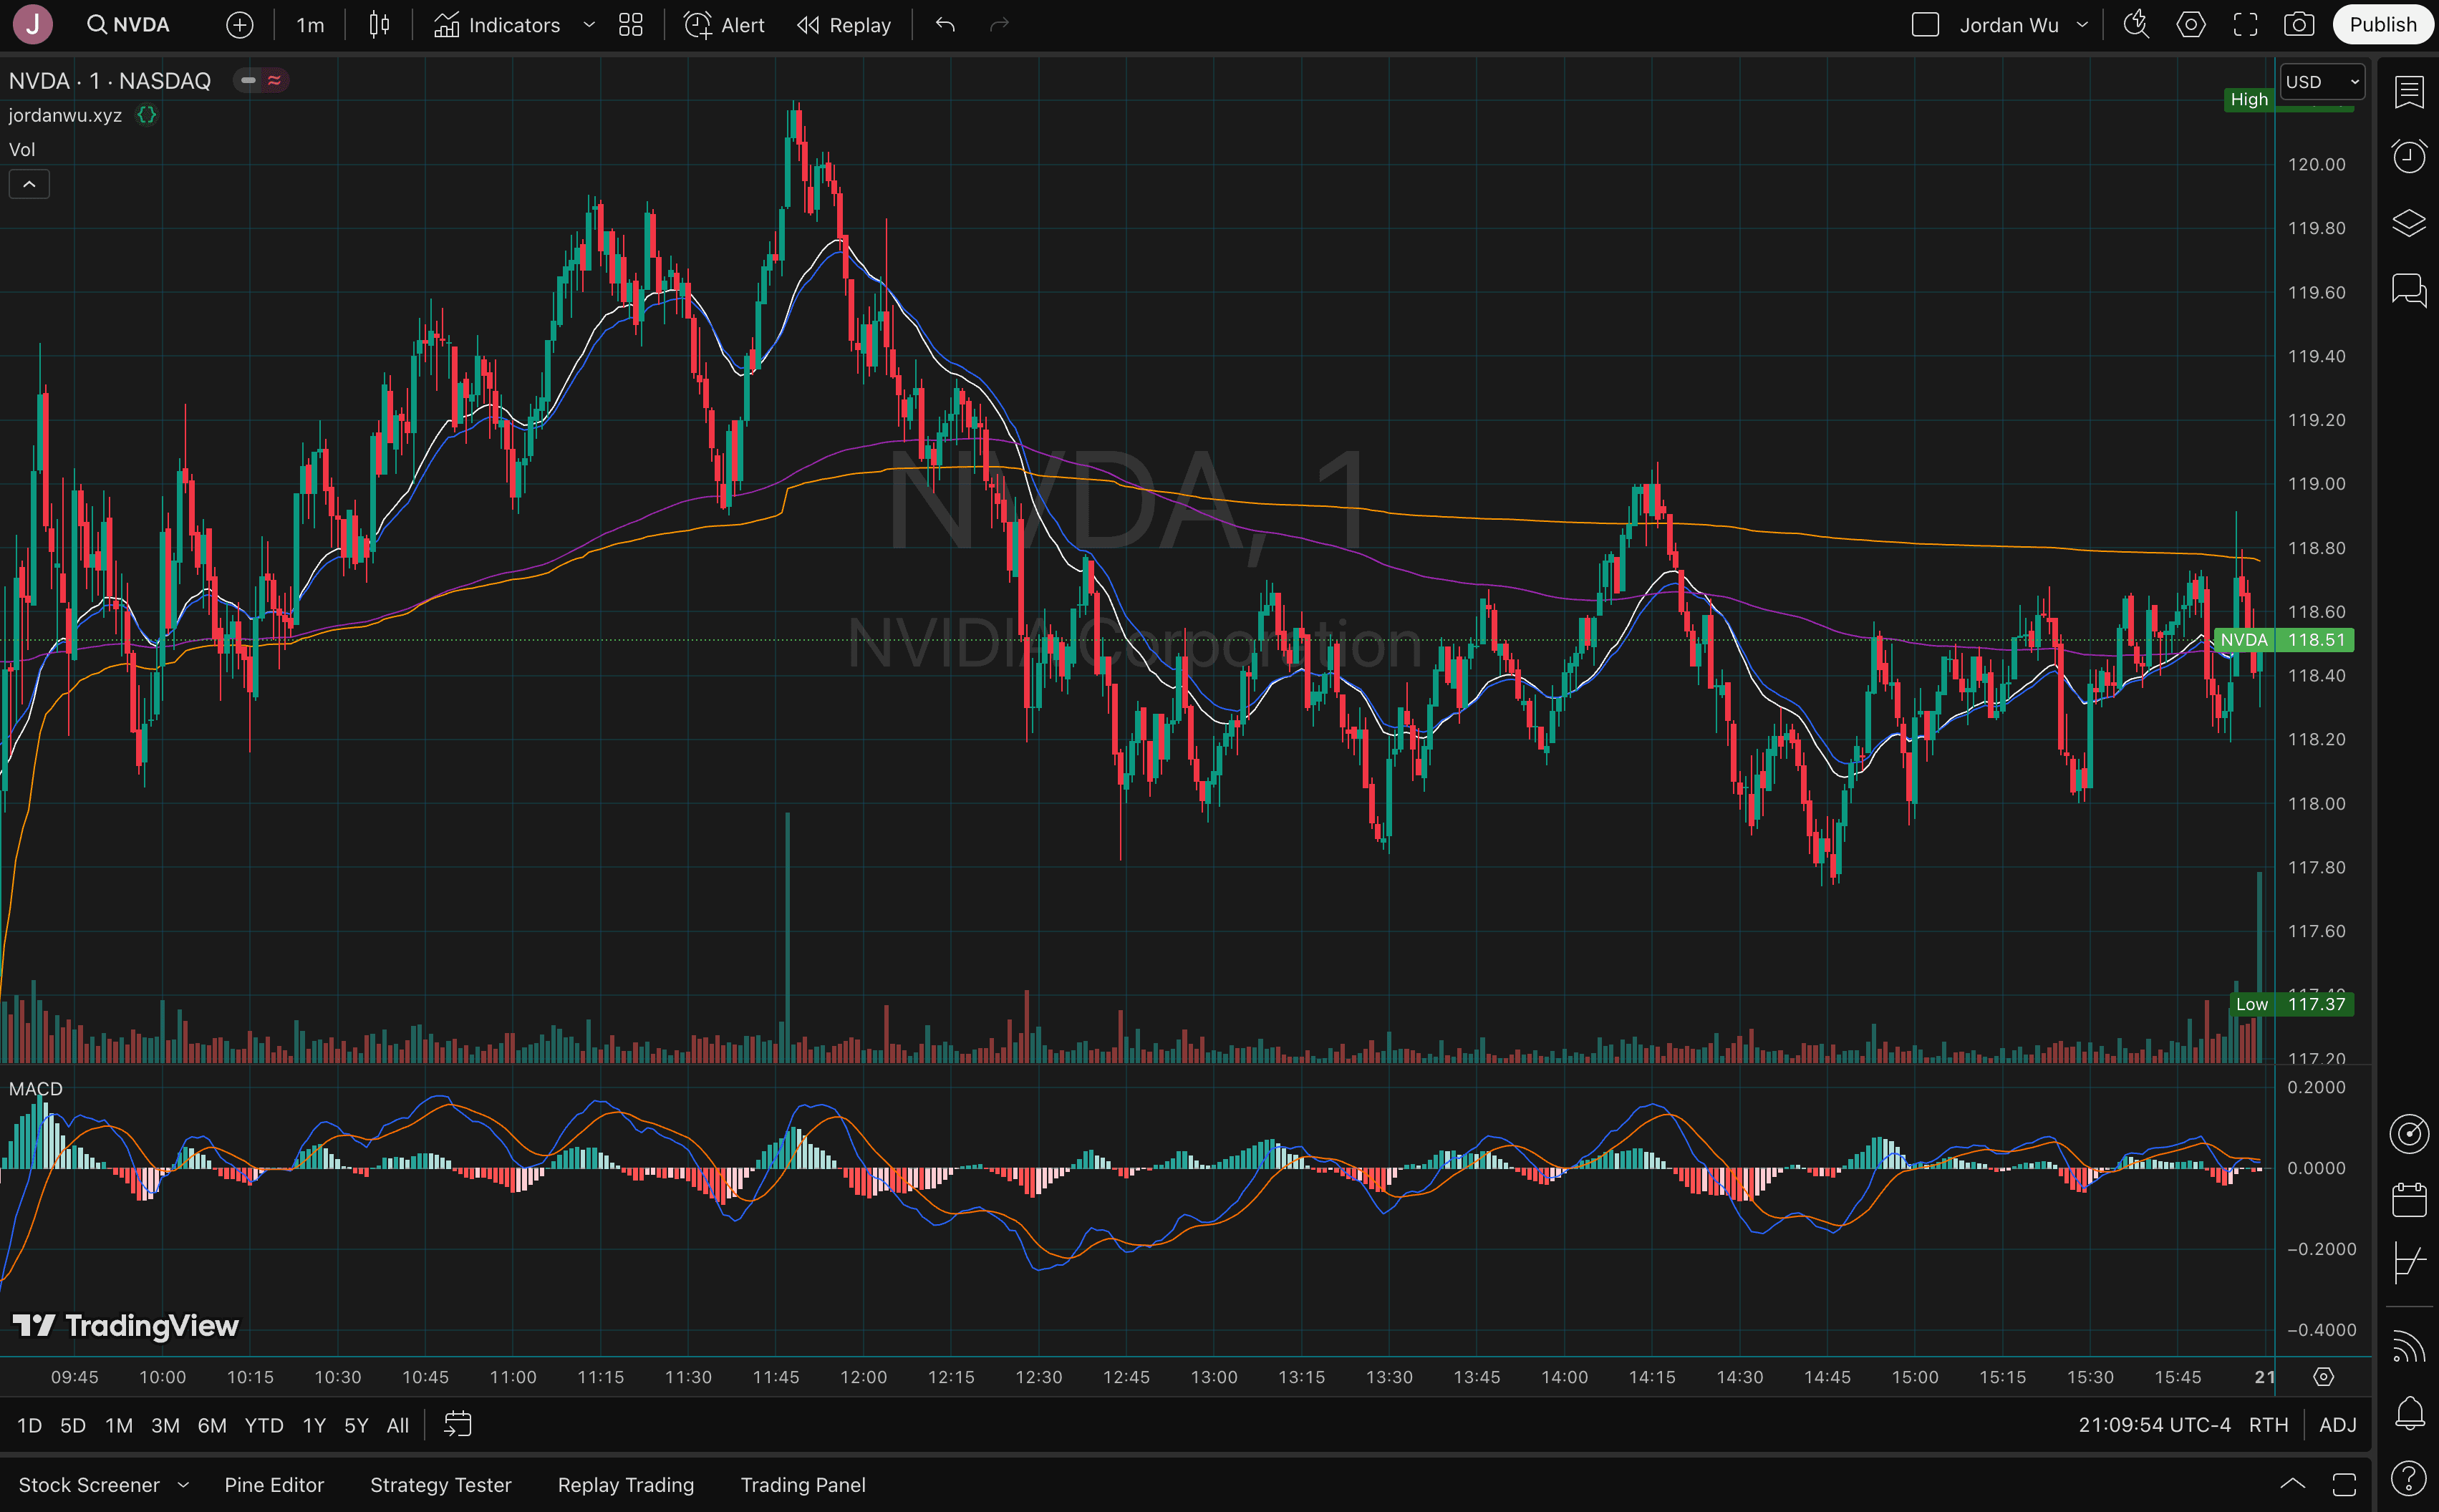
Since the basic plan allows you to have two indicators. One of the indicators is our Pine Script that is showing four indicators, 22-EMA, 26-EMA, 200-EMA, and VWAP. This allows you to add a built-in technical indicator, for example Moving Average Convergence Divergence (MACD). MACD is a trend-following momentum indicator that helps traders identify changes in the strength, direction, and momentum of a stock's price movement.
Let's include another built-in Volume indicator. A volume indicator is a technical analysis tool that measures the number of shares or contracts traded in a given period, helping traders assess the strength of a price movement. High volume typically signals strong interest and confirms trends, while low volume may indicate weak momentum or potential reversals.
When writing Pine Script be sure to check out this blog post Debug your Pine Script™ code with Pine Logs.
Summary
Investing your money across multiple investment vehicles, such as stocks, bonds, real estate, ETFs, mutual funds, and alternative assets. Is essential for building long-term wealth and financial security. Diversifying your investments helps spread risk, reducing the impact of market fluctuations on your overall portfolio. Stocks offer high growth potential, while bonds provide stability and consistent income. Real estate can generate passive income and long-term appreciation, while ETFs and mutual funds allow you to invest in a diversified basket of assets with lower risk. Alternative investments, such as commodities or cryptocurrencies, can act as hedges against inflation and economic uncertainty. By strategically allocating your money across different investment vehicles, you maximize growth opportunities while safeguarding your wealth against unexpected downturns, ultimately achieving financial freedom and long-term stability.
TradingView is an essential tool for traders and investors looking to elevate their market analysis. With its powerful charting features, real-time data, customizable indicators, and much more. It provides everything you need to make informed trading decisions. Whether you're a beginner learning technical analysis or an experienced trader refining your strategy. The basic plan is free to use and you can download the Desktop application. Be sure to checkout Knowledge Base to learn more about the platform, my favorite is financials.
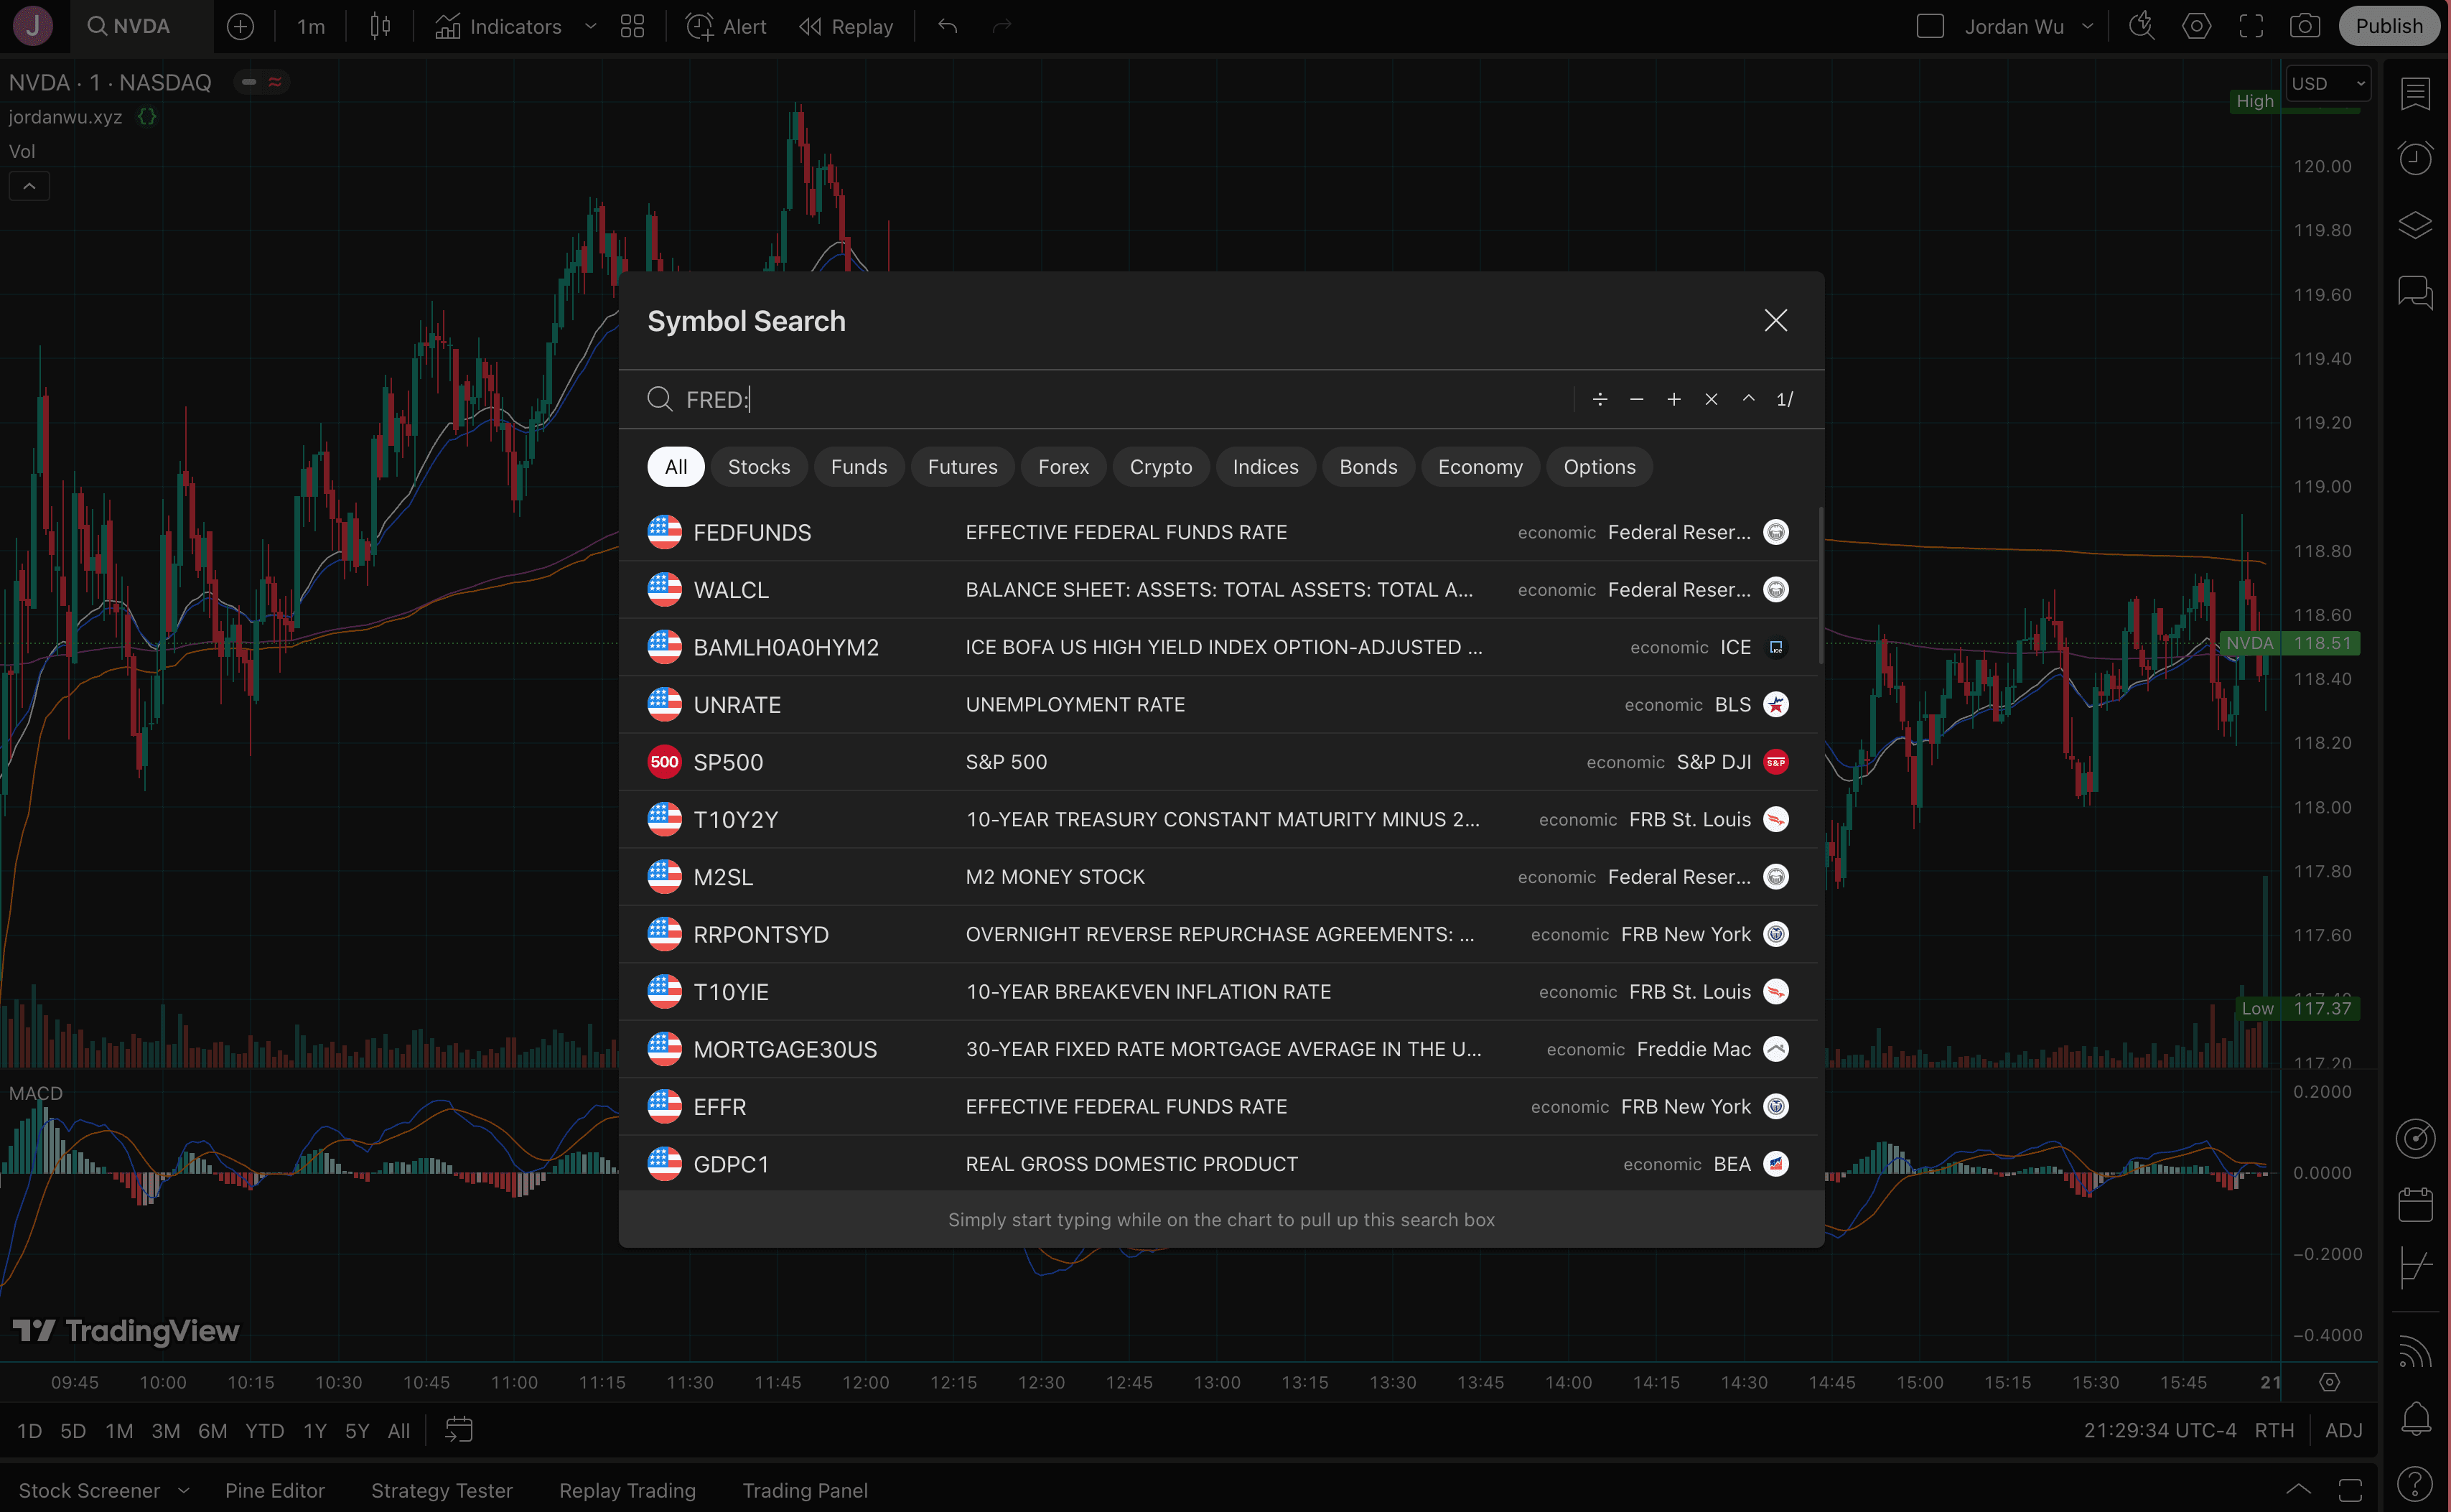
P.S. To view Federal Reserve economic data (FRED) on TradingView, use the FRED: prefix when searching for symbols in the "Symbol Search" window.