How to Improve Your Website Performance
Performance is important in all aspects in life. Your career. Your car. Your phone. You name it. Everything's better when they are performing to your expectation. Having them run at their most optimized speed is your standard. The same goes for your website and in this blog we will be learning how to improve performance using PageSpeed Insights.

Jordan Wu
4 min·Posted

Table of Contents
What is PageSpeed Insights?
PageSpeed Insights (PSI) is a reporting tool on user experience of a page for both mobile and desktop devices. It provides suggestions on how that page may be improved and gives you a score out of 100 for how well it performed.
PSI provides both lab and field data about a page. Lab data is performance data collected within a controlled environment with predefined device and network settings. While field data is performance data collected from real page loads your users are experiencing in the wild. Both are important with an emphasis on real-world performance. It uses Lighthouse to collect and analyze lab data about the page, while real-world field data is based on the Chrome User Experience Report (CrUX) dataset.
It's All About Performance
We all know what great user experience feels like. It feels like everything is working as expected. That's the gold standard users have when using your website. When they are on your website, they aren't only comparing you with your competitors, they're rating you against the best-in-class services they use every day. Everything has to be fast and smooth otherwise they will leave. You can say performance plays a vital role in the success of any website.
When you focus on improving performance you are focusing on creating a successful online venture. You will get more users. They will stay longer and you have a higher chance of getting them to return back to your website in the future. By focusing on improving performance is one step towards success.
Understanding How Websites Render
All browsers go through a series of steps to render web pages. It would need to download all resources then load them on the web page. The sequence of steps are called critical rendering path for initial render. Understanding the critical rendering path will help improve web performance.
- Constructing the Document Object Model (DOM) from the HTML.
- Constructing the CSS Object Model (CSSOM) from the CSS.
- Applying any JavaScript that alters the DOM or CSSOM.
- Constructing the render tree from the DOM and CSSOM.
- Perform style and layout operations on the page to see what elements fit where.
- Paint the pixels of the elements in memory.
- Composite the pixels if any of them overlap.
- Physically draw all the resulting pixels to screen.

As shown in the image above. There's a lot of steps browsers take to get a web page to render with all of its content. This involves downloading all the resources needed like HTML, CSS , JavaScript, Fonts, Images, etc. Once it has the resources it would need to build the DOM tree and paint the content on screen. Only after all the steps have been completed will the user see content on their screen.
User-centric Performance Metrics
When talking about performance, it's important to be precise and to refer to performance in terms of metrics. PSI reports real user's metrics based on the following:
First Contentful Paint (FCP) - It marks the first point in the page load timeline where the user can see anything on the screen. A fast FCP helps reassure the user that something is happening. To provide a good user experience, sites must have an FCP of 1.8 seconds or less. Learn more on how to improve FCP.
Largest Contentful Paint (LCP) - It marks the point in the page load timeline when the page's main content has likely loaded. A fast LCP helps reassure the user that the page is useful. To provide a good user experience, sites should strive to have LCP of 2.5 seconds or less. Learn more on how to improve LCP.
Interaction to Next Paint (INP) - It assesses page responsiveness using data from the Event Timing API. INP observes the latency of all click, tap, and keyboard interactions with a page throughout its lifespan, and reports the longest duration. To provide a good user experience, a site must be equal to or less than 200 milliseconds. Learn more on how to improve INP.
Total Blocking Time (TBT) - It measures the total amount of time after First Contentful Paint (FCP) where the main thread was blocked for long enough to prevent input responsiveness. The blocking time of a given long task is its duration in excess of 50 ms. And the total blocking time for a page is the sum of the blocking time for each long task that occurs after FCP for the measured timeframe. To provide a good user experience, sites should strive to have a Total Blocking Time of less than 200 milliseconds. learn more on how to improve TBT.
Cumulative Layout Shift (CLS) - It measures the largest burst of layout shift scores for every unexpected layout shift that occurs during the lifespan of a page. A layout shift occurs any time a visible element changes its position from one rendered frame to the next. To provide a good user experience, a site must have a CLS score of 0.1 or less. Learn more on how to improve CLS.
Time to First Byte (TTFB) - It measures the time between the request for a resource and when the first byte of a response begins to arrive. This makes it helpful in identifying when a web server is too slow to respond to requests. To provide a good user experience, a site must have a TTFB of 0.8 seconds or less. Learn more on how to improve TTFB.
Speed Index - It measures how quickly content is visually displayed during page load. It uses Lighthouse to display Speed Index in seconds. To provide a good user experience, a site must have a Speed Index of 3.4 seconds or less.
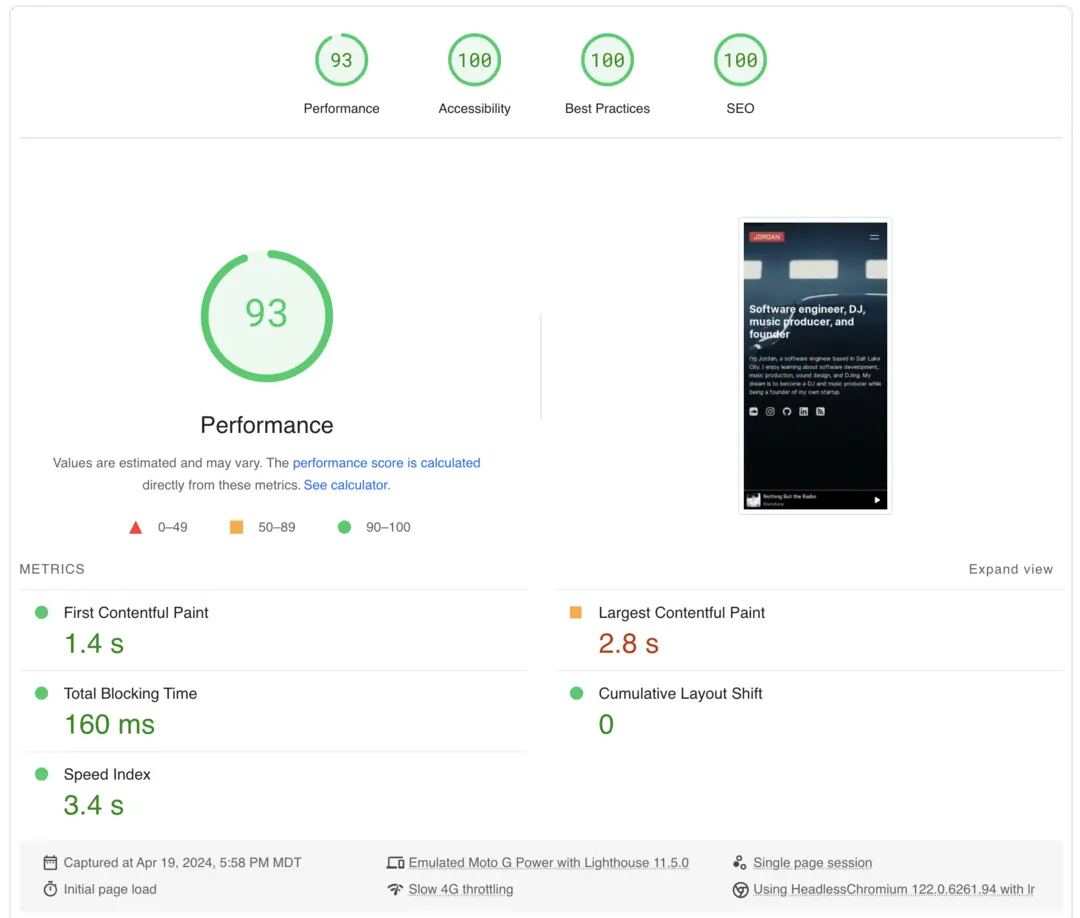
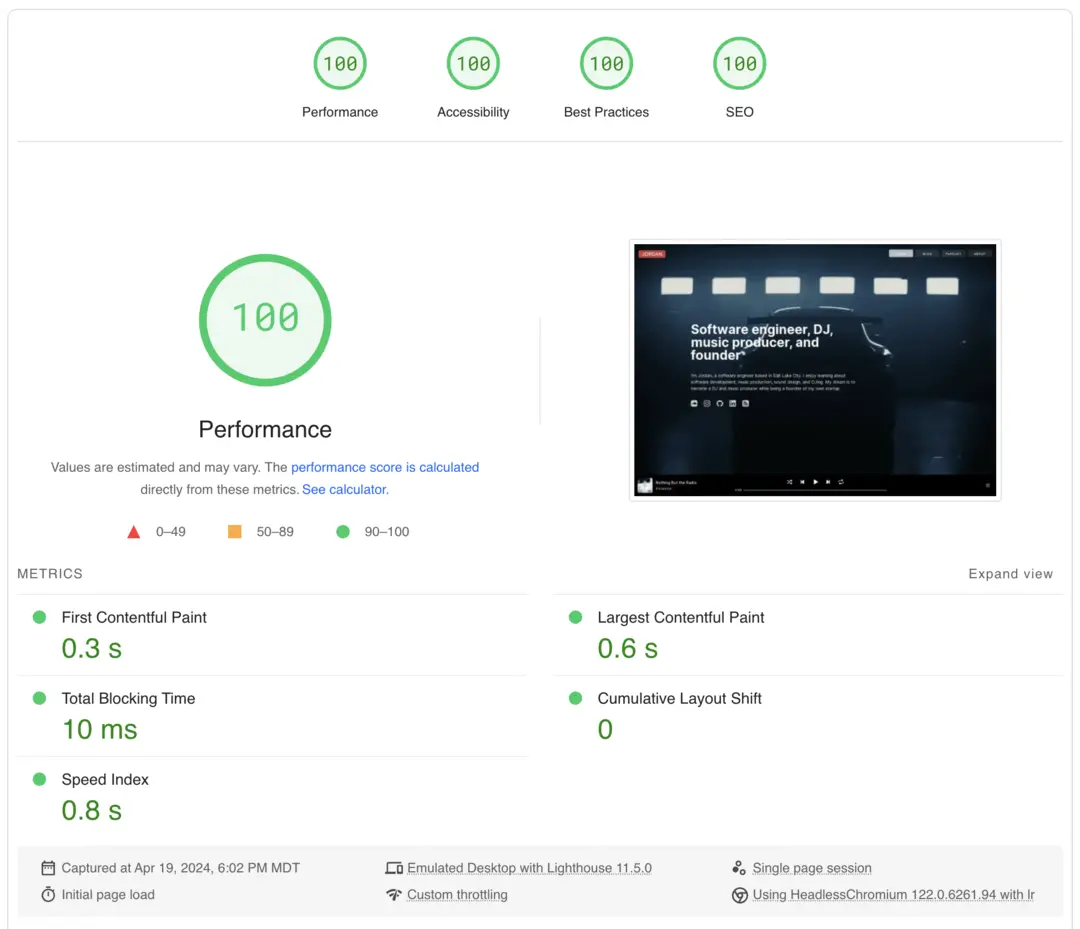
PSI classifies the quality of user experiences into three buckets: Good, Needs Improvement, or Poor. Each of the buckets are color coded. Good, Needs Improvement, and Poor, which are represented by green, amber, and red bars. At the top of the section are scores for each category, determined by running Lighthouse to collect and analyze diagnostic information about the page. A score of 90 or above is considered good. 50 to 89 is a score that needs improvement, and below 50 is considered poor.
Using PageSpeed Insights
I used this tool to improve my website performance focused on the home page. Your home page is in my opinion the most important page. It's the page where users will land when they type in your URL. The tool makes it easy to focus on each of the different categories and provide all the information you need to improve performance. After spending some time using this tool I learned to be more mindful of how to optimize my website's resources while learning more about how to optimize in Next js.